Exam 4: Supply and Demand: Applications and Extensions
Exam 1: The Economic Approach225 Questions
Exam 2: Some Tools of the Economist239 Questions
Exam 3: Demand, Supply, and the Market Process408 Questions
Exam 4: Supply and Demand: Applications and Extensions270 Questions
Exam 5: Difficult Cases for the Market, and the Role of Government184 Questions
Exam 6: The Economics of Political Action208 Questions
Exam 7: Consumer Choice and Elasticity229 Questions
Exam 8: Costs and the Supply of Goods222 Questions
Exam 9: Price Takers and the Competitive Process261 Questions
Exam 10: Price-Searcher Markets With Low Entry Barriers232 Questions
Exam 11: Price-Searcher Markets With High Entry Barriers260 Questions
Exam 12: The Supply of and Demand for Productive Resources154 Questions
Exam 13: Earnings, Productivity, and the Job Market91 Questions
Exam 14: Investment, the Capital Market, and the Wealth of Nations106 Questions
Exam 15: Income Inequality and Poverty105 Questions
Exam 16: Gaining From International Trade179 Questions
Select questions type
Use the figure below illustrating the impact of an excise tax to answer the following question(s).
Figure 4-6 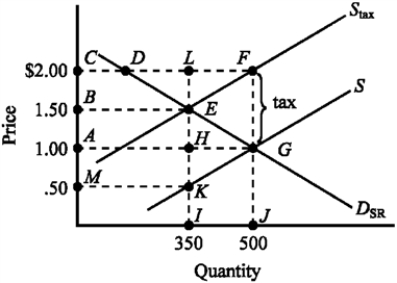 -Refer to Figure 4-6. The amount of the excise tax I is
(Multiple Choice)
4.8/5  (37)
(37)
If a household has $40,000 in taxable income and its tax liability is $20,000, the household's average tax rate is
(Multiple Choice)
4.9/5 (38)
Figure 4-22 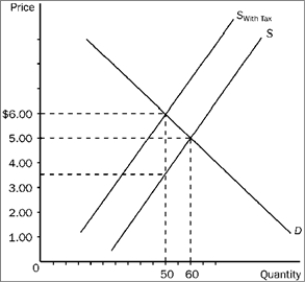 -Refer to Figure 4-22. The equilibrium price in the market before the tax is imposed is
(Multiple Choice)
4.9/5 (33)
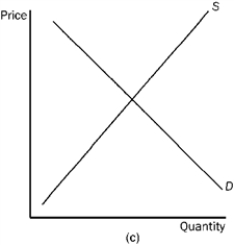
Which of the following would tend to increase the price of lumber?
(Multiple Choice)
4.8/5 (28)
If a $500 tax is placed legally (statutorily) on the sellers of new violins and as a result the price of violins to consumers rises by $400, then the actual burden of the tax
(Multiple Choice)
4.9/5 (39)
Figure 4-23 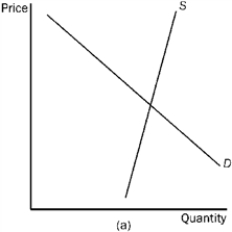
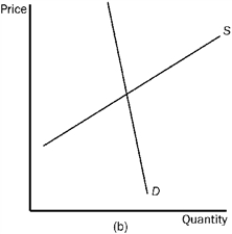
 -Refer to Figure 4-23. In which market will the tax burden be most equally divided between the buyer and the seller?
(Multiple Choice)
4.7/5 (39)
Figure 4-21 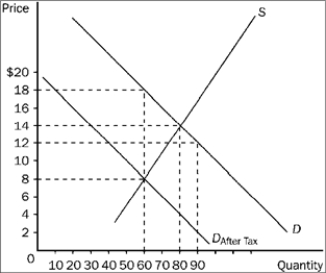 -Refer to Figure 4-21. The price received by sellers after the tax is imposed is
(Multiple Choice)
4.8/5 (37)
When a government subsidy is granted to the sellers of a product, buyers can end up capturing some of the benefit because
(Multiple Choice)
4.8/5 (31)
A price ceiling set below an equilibrium price tends to cause persistent imbalances in the market because
(Multiple Choice)
4.8/5 (41)
Under rent control, landlords cease to be responsive to tenants' concerns about the quality of the housing because
(Multiple Choice)
4.7/5 (29)
If Sophia's tax liability increases from $10,000 to $15,000 when her income increases from $30,000 to $40,000, her marginal tax rate is
(Multiple Choice)
4.8/5 (37)
Use the figure below to answer the following question(s).
Figure 4-4 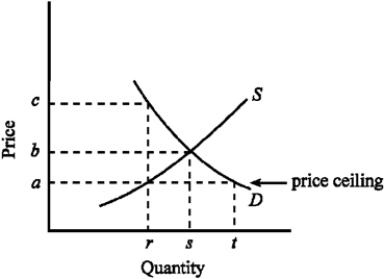 -Given the demand and supply conditions shown in Figure 4-4, if the government imposes a price ceiling of a, which of the following would be true?
(Multiple Choice)
4.9/5 (49)
If the Federal government enacts a new excise tax of $1.50 per case of soda, which of the following is most likely to occur?
(Multiple Choice)
4.9/5 (35)
Because of price controls in the former Soviet Union, people often waited in long lines for food and other necessities. Modern economic theory would indicate that, relative to price rationing, waiting in line is
(Multiple Choice)
5.0/5 (38)
A price floor that sets the price of a good above market equilibrium will cause
(Multiple Choice)
4.9/5 (33)
A price floor set above an equilibrium price tends to cause persistent imbalances in the market because
(Multiple Choice)
4.8/5 (40)
Economists have argued that rent control is "the best way to destroy a city, other than bombing." Why would economists say this?
(Multiple Choice)
4.9/5 (43)
Use the figure below to answer the following question(s).
Figure 4-13 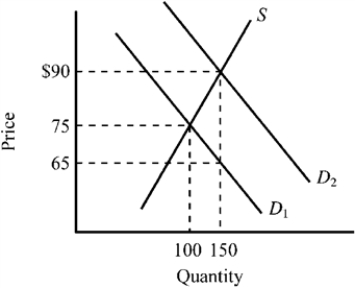 -Refer to Figure 4-13. The supply curve S and the demand curve D1 indicate initial conditions in the market for flu shots. A new government program is implemented that grants buyers a $25 subsidy when they buy a flu shot, shifting the demand curve from D1 to D2. Which of the following is true for this subsidy given the information provided in the figure?
(Multiple Choice)
4.9/5 (38)
Filters
- Essay(0)
- Multiple Choice(0)
- Short Answer(0)
- True False(0)
- Matching(0)