Exam 4: Supply and Demand: Applications and Extensions
Exam 1: The Economic Approach225 Questions
Exam 2: Some Tools of the Economist239 Questions
Exam 3: Demand, Supply, and the Market Process408 Questions
Exam 4: Supply and Demand: Applications and Extensions270 Questions
Exam 5: Difficult Cases for the Market, and the Role of Government184 Questions
Exam 6: The Economics of Political Action208 Questions
Exam 7: Consumer Choice and Elasticity229 Questions
Exam 8: Costs and the Supply of Goods222 Questions
Exam 9: Price Takers and the Competitive Process261 Questions
Exam 10: Price-Searcher Markets With Low Entry Barriers232 Questions
Exam 11: Price-Searcher Markets With High Entry Barriers260 Questions
Exam 12: The Supply of and Demand for Productive Resources154 Questions
Exam 13: Earnings, Productivity, and the Job Market91 Questions
Exam 14: Investment, the Capital Market, and the Wealth of Nations106 Questions
Exam 15: Income Inequality and Poverty105 Questions
Exam 16: Gaining From International Trade179 Questions
Select questions type
Figure 4-20 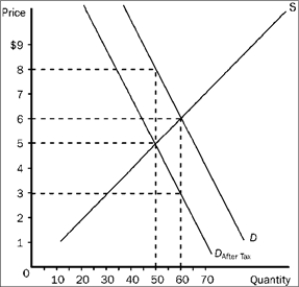 -Refer to Figure 4-20. The price that buyers pay after the tax is imposed is
(Multiple Choice)
4.8/5  (35)
(35)
Which of the following examples illustrates a progressive income tax?
(Multiple Choice)
4.7/5 (42)
Figure 4-24 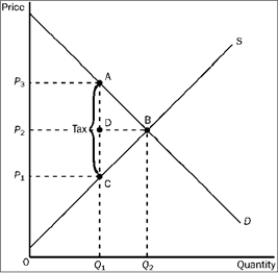 -Refer to Figure 4-24. The amount of the tax on each unit of the good is
(Multiple Choice)
4.9/5 (36)
Use the figure below illustrating the impact of an excise tax to answer the following question(s).
Figure 4-6 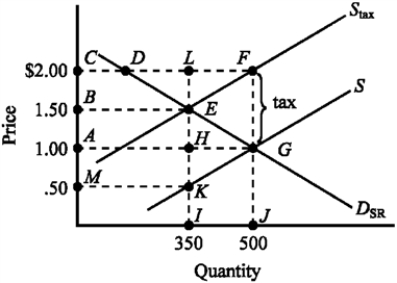 -The deadweight loss of the tax illustrated in Figure 4-6 is given by the area
(Multiple Choice)
4.9/5 (33)
If the supply of health care services is highly inelastic, programs that subsidize the cost of purchasing medical services will
(Multiple Choice)
4.8/5 (38)
Use the figure below to answer the following question(s).
Figure 4-12 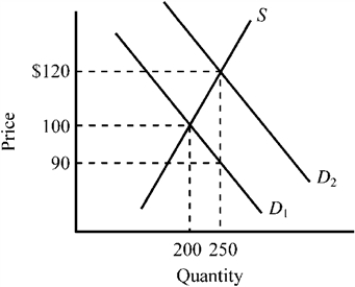 -Refer to Figure 4-12. The supply curve S and the demand curve D1 indicate initial conditions in the market for college textbooks. A new government program is implemented that grants students a $30 per textbook subsidy on every textbook they purchase, shifting the demand curve from D1 to D2. Which of the following is true for this subsidy given the information provided in the exhibit?
(Multiple Choice)
4.9/5 (41)
Figure 4-16 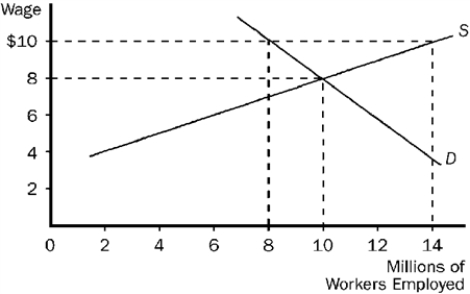 -Refer to Figure 4-16. Some policymakers have argued that the government should establish a "living wage." A living wage would provide workers a reasonable standard of living in their city or region. If a living wage of $10 per hour is established in the market pictured here, we would expect
(Multiple Choice)
4.8/5 (26)
About 35,000 general aviation multiengine airplanes are licensed to operate in the United States. If an additional $1,000-per-year tax was levied on each plane to raise general revenue, economic thinking suggests the
(Multiple Choice)
4.8/5 (40)
Figure 4-24
-Refer to Figure 4-24. The price that buyers pay after the tax is imposed is
(Multiple Choice)
4.9/5 (32)
After a natural disaster, such as a hurricane, the increased demand for certain items (like lumber, electric generators, and chainsaws) causes their prices to rise. These higher prices
(Multiple Choice)
4.7/5 (39)
The actual benefit of a government subsidy is determined primarily by
(Multiple Choice)
4.7/5 (43)
Use the figure below illustrating the impact of an excise tax to answer the following question(s).
Figure 4-6
-Refer to Figure 4-6. The amount of the actual tax burden paid by consumers and producers is
(Multiple Choice)
4.8/5 (35)
Figure 4-22 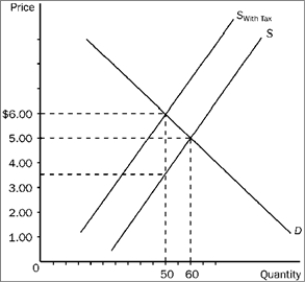 -Refer to Figure 4-22. Buyers pay how much of the tax per unit?
(Multiple Choice)
4.7/5 (35)
Figure 4-19 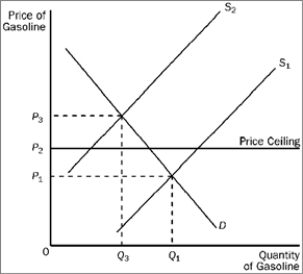 -Refer to Figure 4-19. When the price ceiling applies in this market and the supply curve for gasoline shifts from S1 to S2,
(Multiple Choice)
4.9/5 (37)
Figure 4-21 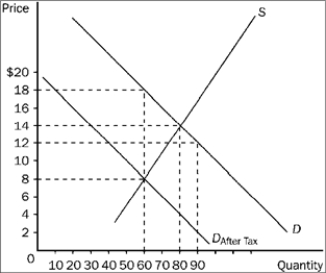 -Refer to Figure 4-21. The price paid by buyers after the tax is imposed is
(Multiple Choice)
4.7/5 (36)
Many economists believe a general sales tax (particularly on items such as food) takes a larger proportion of income from low-income households than from high-income households. If this is true, a general sales tax is a
(Multiple Choice)
4.7/5 (38)
Which of the following would tend to increase the wage of coal miners?
(Multiple Choice)
4.7/5 (37)
Filters
- Essay(0)
- Multiple Choice(0)
- Short Answer(0)
- True False(0)
- Matching(0)