Exam 3: Quadratic and Other Special Functions
Exam 1: Algebraic Concepts308 Questions
Exam 2: Linear Equations and Functions243 Questions
Exam 3: Quadratic and Other Special Functions113 Questions
Exam 4: Matrices227 Questions
Exam 5: Inequalities and Linear Programming120 Questions
Exam 6: Exponential and Logarithmic Functions108 Questions
Exam 7: Mathematics of Finance131 Questions
Exam 8: Introduction to Probability178 Questions
Exam 9: Further Topics in Probability; Data Description114 Questions
Exam 10: Derivatives248 Questions
Exam 11: Applications of Derivatives172 Questions
Exam 12: Derivatives Continued139 Questions
Exam 13: Indefinite Integrals120 Questions
Exam 14: Definite Integrals: Techniques of Integration185 Questions
Exam 15: Functions of Two or More Variables119 Questions
Select questions type
The graph of the profit function 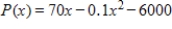 is given as follows. Consider the average rate of change of the profit from a to 350 where a lies to the left of 350. Does the average rate of change of the profit get closer to 0 or farther from 0 as a gets closer to 350?
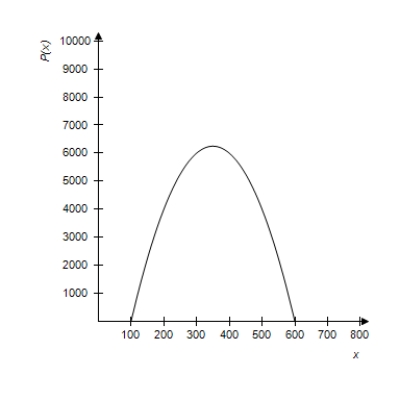
Free
(Multiple Choice)
4.8/5  (37)
(37)
Correct Answer: Verified
A
Find the maximum revenue for the revenue function  . Round your answer to the nearest cent.
Free
(Multiple Choice)
4.9/5 (38)
Correct Answer:Verified
A
Suppose that the following table gives the number of near-collisions on the runways of the nation's airports. With  representing 1990, find a quadratic function that models the data in the chart. Round numerical values in your answer to four decimal places. Depending on the technology you use, your answer may be slightly different than the correct answer shown.
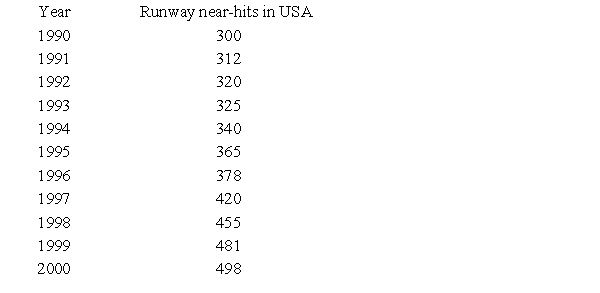
Free
(Multiple Choice)
4.7/5 (37)
Correct Answer:Verified
A
Determine whether the vertex of the graph of the following function is a maximum point or a minimum point. Also find the coordinates of the vertex. 
(Multiple Choice)
4.8/5 (38)
A fissure in the earth appeared after an earthquake. To measure its vertical depth, a stone was dropped into it, and the sound of the stone's impact was heard 3.3 seconds later. The distance (in feet) the stone fell is given by  , and the distance (in feet) the sound traveled is given by
  . In these equations, the distances traveled by the sound and the stone are the same, but their times are not. Using the fact that the total time is 3.3 seconds, find the depth of the fissure. Round your answer to two decimal places.
(Multiple Choice)
4.9/5 (39)
Determine if the vertex of the graph of the equation is a maximum or minumim point. 
(Multiple Choice)
4.8/5 (33)
The table below shows the national expenditures for health care in a certain country for selected years. Find a power model and a linear model for the data where x is the number of years after 1950. Which of the models seems to be the best to use if you are interested in finding the health care costs near the year 1990? Round numerical values in your answers to three decimal places. 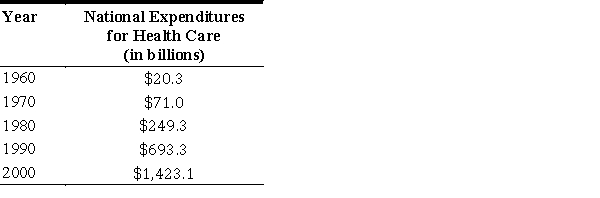
(Multiple Choice)
4.9/5 (37)
Determine whether the given graph is the graph of a polynomial function, a rational function (but not a polynomial), or a piecewise defined function. Use the graph to estimate the turning points and any asymptotes. 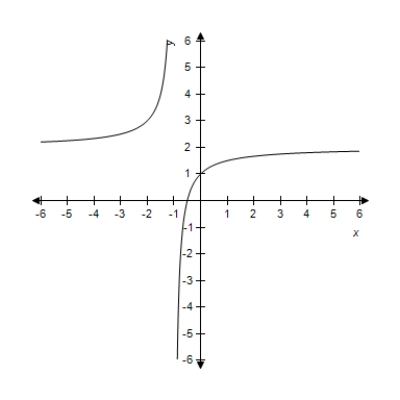
(Multiple Choice)
4.9/5 (33)
The table shows the average earnings of year-round, full-time workers by gender and educational attainment in a certain country. Let x represent earnings for males and y represent earnings for females, and find a linear model that expresses women's annual earnings as a function of men's. Interpret the slope of the linear model. Round your final values to three decimal places. 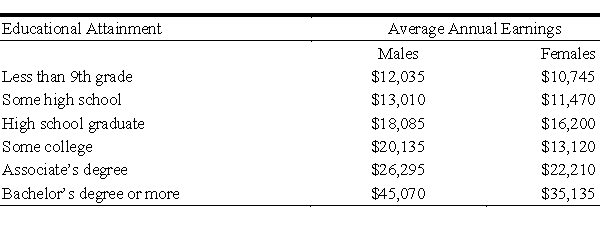
(Multiple Choice)
4.9/5 (39)
By recognizing shapes and features of polynomial functions, sketch the graph of the function  . Use a graphing utility to confirm your graph.
(Multiple Choice)
4.7/5 (37)
The total costs for a company are given by 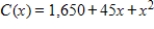 , and the total revenues are given by
  . Find the break-even points.
(Multiple Choice)
4.9/5 (44)
Find the x-intercepts, if any exist. Round your answers to two decimal places. 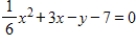
(Multiple Choice)
4.9/5 (31)
Find the exact real solutions of the equation 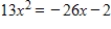 , if they exist.
(Multiple Choice)
5.0/5 (43)
Solve the equation by using the quadratic formula. Give real answers rounded to two decimal places. 
(Multiple Choice)
4.8/5 (38)
If a ball is thrown upward at 80 feet per second from the top of a building that is 100 feet high, the height of the ball can be modeled by 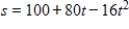 , where t is the number of seconds after the ball is thrown. How long after it is thrown is the height 100 feet?
(Multiple Choice)
4.9/5 (33)
If a company has total costs 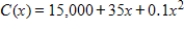 , and total revenues given by
 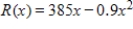 , find the break-even points. Round your answers to two decimal places.
(Multiple Choice)
4.9/5 (27)
Solve the equation 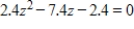 by using a graphing utility. Round your answers to two decimal places.
(Multiple Choice)
4.7/5 (37)
Use a graphing utility to find the vertex of the function. Round your answer to two decimal places. 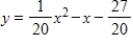
(Multiple Choice)
4.8/5 (32)
Filters
- Essay(0)
- Multiple Choice(0)
- Short Answer(0)
- True False(0)
- Matching(0)