Exam 9: Further Topics in Probability; Data Description
Exam 1: Algebraic Concepts308 Questions
Exam 2: Linear Equations and Functions243 Questions
Exam 3: Quadratic and Other Special Functions113 Questions
Exam 4: Matrices227 Questions
Exam 5: Inequalities and Linear Programming120 Questions
Exam 6: Exponential and Logarithmic Functions108 Questions
Exam 7: Mathematics of Finance131 Questions
Exam 8: Introduction to Probability178 Questions
Exam 9: Further Topics in Probability; Data Description114 Questions
Exam 10: Derivatives248 Questions
Exam 11: Applications of Derivatives172 Questions
Exam 12: Derivatives Continued139 Questions
Exam 13: Indefinite Integrals120 Questions
Exam 14: Definite Integrals: Techniques of Integration185 Questions
Exam 15: Functions of Two or More Variables119 Questions
Select questions type
Data on the amounts of federal on-budget funds for research programs at universities and related institutions for selected years appear in the table below. What is the standard deviation of the federal on-budget funds for research programs for this period? Round your answer to three decimal places. 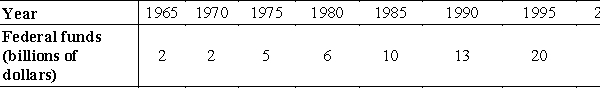
(Multiple Choice)
4.9/5  (29)
(29)
Suppose a company has 11 employees, 1 earning $160,000, 2 earning $120,000, 3 earning $60,000, 4 earning $40,000, and 1 earning $32,000. What is the mode of the salaries?
(Multiple Choice)
4.8/5 (26)
Suppose a population of scores x is normally distributed with  and
and  . Use the standard normal distribution to find
 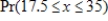 . Round your answer to four decimal places.
(Multiple Choice)
4.7/5 (41)
Estimate the variance for the following probability distribution to two decimal places. 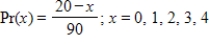
(Multiple Choice)
4.7/5 (38)
The manager of a store buys portable radios in lots of 12. Suppose that, on the average, 2 out of each group of 12 are defective. The manager randomly selects 6 radios out of the group to test. What is the probability that he will find 3 defective radios? Round your answer to six decimal places.
(Multiple Choice)
4.7/5 (28)
Find the median of the set of scores.
24)8, 28.4, 27.3, 27.3, 29.2
(Multiple Choice)
4.8/5 (32)
Find the median of the set of scores.
16, 19, 21, 30, 40, 26, 24, 32
(Multiple Choice)
5.0/5 (27)
Suppose a population of scores x is normally distributed with  and
and  . Use the standard normal distribution to find
 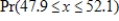 . Round your answer to four decimal places.
(Multiple Choice)
4.9/5 (28)
Suppose according to one of Mendel's hybridization experiments, when peas with green pods were crossed with peas with yellow pods, 45% of the offspring pods should be yellow. What is the probability that at least 267 of 570 offspring peas would have yellow pods? Round your answer to four decimal places.
(Multiple Choice)
4.8/5 (35)
If a die is rolled 39 times, what is the probability that a 6 will occur at least 12 times? Round your answer to four decimal places.
(Multiple Choice)
4.9/5 (40)
The following table defines a discrete probability distribution. Find the expected value of the distribution. 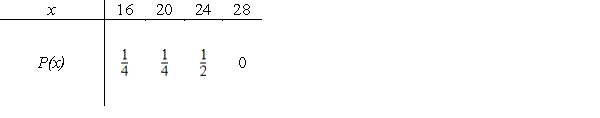
(Multiple Choice)
4.7/5 (38)
The following bar graph shows the size of the average farm (in acres) for selected years from 1940 to 2000. Which table shows the data displayed in the graph? 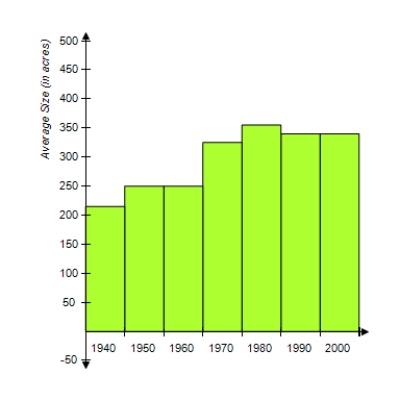
(Multiple Choice)
4.9/5 (28)
A nonprofit organization sells chances for a $40,000 automobile at $125 per ticket. It sells 2,000 tickets and offers four prizes, summarized in the table that follows. What are the expected winnings (or loss) for each ticket? 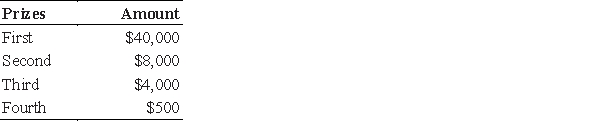
(Multiple Choice)
4.9/5 (25)
A baseball player has a lifetime batting average of 0.3. If he comes to bat 7 times in a given game, what is the probability that he will get more than 3 hits? Round your answer to six decimal places.
(Multiple Choice)
4.8/5 (36)
Use a table of the standard normal distribution to find the probability that a z-score from the standard normal distribution will lie within the interval  . Round your answer to four decimal places.
(Multiple Choice)
4.8/5 (51)
The mean weight of a group of boys is 165 lb, with a standard deviation of 20 lb. If the weights are normally distributed, find the probability that one of the boys picked at random from the group weighs between 150 and 195 lb. Round your answer to four decimal places.
(Multiple Choice)
4.9/5 (31)
A new car with a $19,700 list price can be bought for different prices from different dealers. In one city the car can be bought for $18,900 from 2 dealers, for $17,500 from 1 dealer, for $17800 from 3 dealers, for $18,300 from 2 dealers, and for $18,200 from 2 dealers. What are the mean and standard deviation of this sample of car prices? Round your answer to two decimal places wherever applicable.
(Multiple Choice)
4.7/5 (39)
Use a table of the standard normal distribution to find the probability that a z-score from the standard normal distribution will lie within the interval  . Round your answer to four decimal places.
(Multiple Choice)
4.9/5 (38)
The percents of total households that contain married couples for the years 1982 to 2006 are given in the table below. Construct a frequency histogram of the percents. 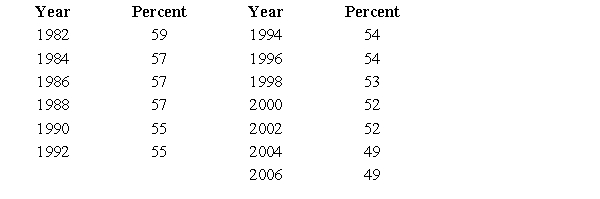
(Multiple Choice)
4.8/5 (32)
A multiple-choice test has 45 questions and 5 choices for each question. If a student is totally unprepared and guesses on each question, how many questions can she expect to answer correctly, and what is the standard deviation of the number of correct answers? Round any estimated quantities to two decimal places.
(Multiple Choice)
4.8/5 (36)
Filters
- Essay(0)
- Multiple Choice(0)
- Short Answer(0)
- True False(0)
- Matching(0)