Exam 14: Definite Integrals: Techniques of Integration
Exam 1: Algebraic Concepts308 Questions
Exam 2: Linear Equations and Functions243 Questions
Exam 3: Quadratic and Other Special Functions113 Questions
Exam 4: Matrices227 Questions
Exam 5: Inequalities and Linear Programming120 Questions
Exam 6: Exponential and Logarithmic Functions108 Questions
Exam 7: Mathematics of Finance131 Questions
Exam 8: Introduction to Probability178 Questions
Exam 9: Further Topics in Probability; Data Description114 Questions
Exam 10: Derivatives248 Questions
Exam 11: Applications of Derivatives172 Questions
Exam 12: Derivatives Continued139 Questions
Exam 13: Indefinite Integrals120 Questions
Exam 14: Definite Integrals: Techniques of Integration185 Questions
Exam 15: Functions of Two or More Variables119 Questions
Select questions type
Suppose spending for a wireless communications services (in billions of dollars per year) can be modeled by the function 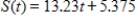 where
where  represents 1995. Use
  equal subdivisions with right-hand endpoints to approximate the area under the graph of S(t) between
  and
and  . Round your answer to one decimal place.
(Multiple Choice)
4.9/5  (42)
(42)
The supply function for a good is 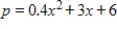 , where p is the number of dollars and x is the number of units. If the equilibrium price is $27 what is the producer's surplus at the equilibrium price? Round to the nearest cent.
(Multiple Choice)
4.7/5 (41)
The demand function for a product is  where p is in millions of dollars and x is the number of thousands of units. If the equilibrium price is $6 million, what is the consumer's surplus? Round your answer to the nearest million dollars.
(Multiple Choice)
4.8/5 (28)
Use integration by parts to evaluate the integral  . Note that evaluation may require integration by parts more than once.
(Multiple Choice)
4.7/5 (32)
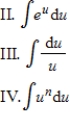
Determine the most appropriate method or integral formula for evaluating the given integral. Next, evaluate the integral.
I. Integration by parts

(Multiple Choice)
4.7/5 (38)
Suppose a land developer is planning to dig a small lake and build a group of homes around it. To estimate the cost of the project, the area of the lake must be calculated from the proposed measurements (in feet) given in the following figure and in the table. Use Simpson's Rule to approximate the area of the lake. Round your answer to two decimal places. 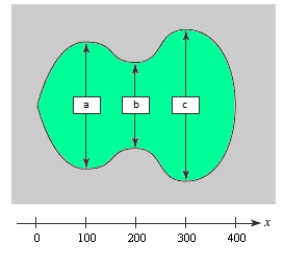 where a = 300, b = 200, c = 400

(Multiple Choice)
4.8/5 (37)
The following income distribution data define points on Lorenz curves, where x represents the fraction of a certain country's population and L(x) the cumulative percent of income held by fraction x. Use this data and a numerical method to evaluate 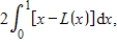 and hence to find the Gini coefficient of income for this country in 1995 and 2003. Round your answers to three decimal places.
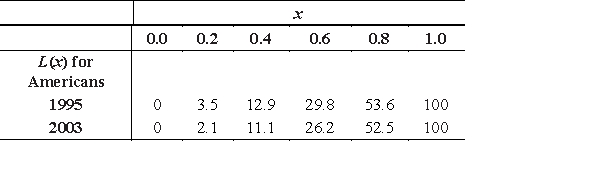
(Multiple Choice)
4.9/5 (36)
The demand function for a product is 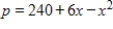 , and the supply function for it is
 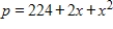 , where p is the number of dollars and x is the number of units. If the equilibrium price is $248 what is the producer's surplus at the equilibrium price? Round to the nearest cent.
(Multiple Choice)
4.8/5 (40)
Find the area of the shaded region. Round to the nearest hundredth if necessary. 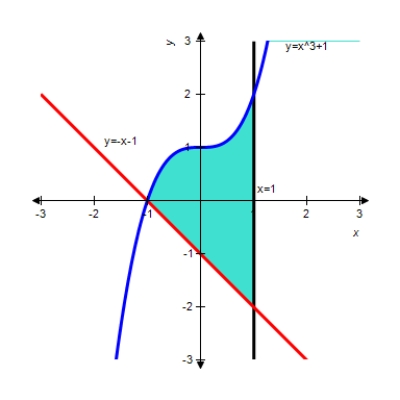
(Multiple Choice)
4.8/5 (38)
A small brewery considers the output of its bottling machine as a continuous income stream with an annual rate of flow at time t given by  in thousands of dollars per year. Find the income from this stream for the next 30 years. Round your answer to the nearest dollar.
(Multiple Choice)
4.8/5 (38)
Suppose that the rate of production of a product (in units per week) is measured at the end of each of the first 5 weeks after start-up, and the following data are obtained. Use the Trapezoidal Rule to approximate the total number of units produced in the first 5 weeks. Round your answer to two decimal places. 
(Multiple Choice)
4.7/5 (41)
The United States' spending for military (in billions of dollars per year) can be modeled by 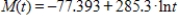 , where
  represents 1993. Estimate the total spending for the United States military between 2000 and 2005 by using 10 equal subdivisions and right-hand endpoints to approximate the area under the graph of M(t) between
  and
and  . Round to three decimal places.
(Multiple Choice)
4.8/5 (35)
Suppose the Lorenz curve for the distribution of income of a certain country is given by  Find the Gini coefficient of income. Round your answer to three decimal places.
(Multiple Choice)
4.8/5 (40)
Filters
- Essay(0)
- Multiple Choice(0)
- Short Answer(0)
- True False(0)
- Matching(0)