Exam 2: Descriptive Statistics: Tabular and Graphical Displays
Exam 1: Data and Statistics66 Questions
Exam 2: Descriptive Statistics: Tabular and Graphical Displays69 Questions
Exam 3: Descriptive Statistics: Numerical Measures103 Questions
Exam 4: Introduction to Probability86 Questions
Exam 5: Discrete Probability Distributions68 Questions
Exam 6: Continuous Probability Distributions74 Questions
Exam 7: Sampling and Sampling Distributions85 Questions
Exam 8: Interval Estimation115 Questions
Exam 9: Hypothesis Tests81 Questions
Exam 10: Inference About Means and Proportions With Two Populations21 Questions
Exam 11: Inferences About Population Variances72 Questions
Exam 12: Tests of Goodness of Fit, Independence, and Multiple Proportions37 Questions
Exam 13: Experimental Design and Analysis of Variance120 Questions
Exam 14: Simple Linear Regression64 Questions
Exam 15: Multiple Regression43 Questions
Exam 16: Regression Analysis: Model Building36 Questions
Exam 17: Time Series Analysis and Forecasting47 Questions
Exam 18: Nonparametric Methods18 Questions
Exam 19: Statistical Methods for Quality Control51 Questions
Exam 20: Decision Analysis29 Questions
Exam 21: Sample Survey33 Questions
Select questions type
Excel's __________ can be used to construct a frequency distribution for categorical data.
(Multiple Choice)
4.8/5  (30)
(30)
What is the difference between a bar graph and a histogram?
(Multiple Choice)
4.9/5 (39)
Excel's __________ can be used to construct a frequency distribution for quantitative data.
(Multiple Choice)
5.0/5 (30)
Fifteen percent of the students in a School of Business Administration are majoring in Economics, 20% in Finance, 35% in Management, and 30% in Accounting. The graphical device(s) that can be used to present these data is(are) _____.
(Multiple Choice)
4.8/5 (29)
In a class with 30 students, we ask, "If you could have any super power, what would it be?" Each student could only choose one super power. The resulting pie chart is below. The least popular choice of super power was _____. 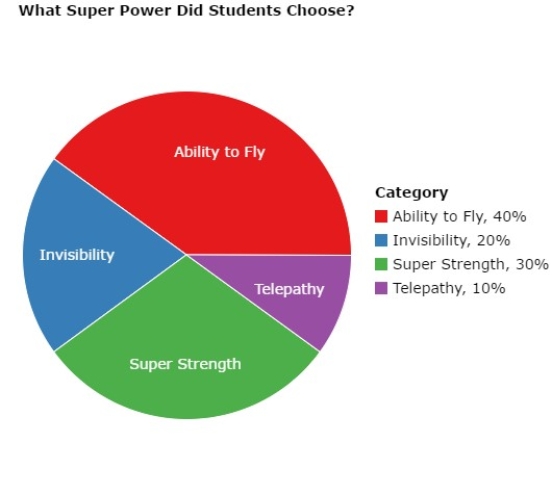
(Multiple Choice)
4.8/5 (35)
If several frequency distributions are constructed from the same data set, the distribution with the widest class width will have the _____.
(Multiple Choice)
4.9/5 (32)
You are given the following data on the earnings per share for 10 companies. Construct a stem-and-leaf display. Specify the leaf unit for the display. 2.6 1.4 1.3 0.5 2.2 1.1 1.1 0.7 0.9 2.0
(Essay)
4.8/5 (33)
Which of the following graphical methods is most appropriate for categorical data?
(Multiple Choice)
4.8/5 (39)
There are 20 boys and 8 girls in a class. What type of graph can be used to display this information?
(Multiple Choice)
4.9/5 (33)
Which of the following is LEAST useful in studying the relationship between two variables?
(Multiple Choice)
4.9/5 (41)
The sum of the relative frequencies for all classes will always equal _____.
(Multiple Choice)
4.7/5 (35)
For the following observations, indicate what kind of relationship (if any) exists between women's height (inches) and annual starting salary ($1000s). Height Salary 64 45 63 40 68 39 65 38 67 42 66 45 65 43 64 35 66 33
(Essay)
4.9/5 (34)
To construct a pie chart using Excel's Chart Tools, choose __________ as the chart type.
(Multiple Choice)
4.8/5 (38)
You are given the following data on times (in minutes) to complete a race. Construct a stem-and-leaf display. Specify the leaf unit for the display. 15.2 15.8 12.4 11.9 15.2 14.7 14.8 11.8 12.0 12.1
(Essay)
5.0/5 (35)
A graphical method that can be used to show both the rank order and shape of a data set simultaneously is a _____.
(Multiple Choice)
4.7/5 (35)
Filters
- Essay(0)
- Multiple Choice(0)
- Short Answer(0)
- True False(0)
- Matching(0)