Exam 2: Descriptive Statistics: Tabular and Graphical Displays
Exam 1: Data and Statistics66 Questions
Exam 2: Descriptive Statistics: Tabular and Graphical Displays69 Questions
Exam 3: Descriptive Statistics: Numerical Measures103 Questions
Exam 4: Introduction to Probability86 Questions
Exam 5: Discrete Probability Distributions68 Questions
Exam 6: Continuous Probability Distributions74 Questions
Exam 7: Sampling and Sampling Distributions85 Questions
Exam 8: Interval Estimation115 Questions
Exam 9: Hypothesis Tests81 Questions
Exam 10: Inference About Means and Proportions With Two Populations21 Questions
Exam 11: Inferences About Population Variances72 Questions
Exam 12: Tests of Goodness of Fit, Independence, and Multiple Proportions37 Questions
Exam 13: Experimental Design and Analysis of Variance120 Questions
Exam 14: Simple Linear Regression64 Questions
Exam 15: Multiple Regression43 Questions
Exam 16: Regression Analysis: Model Building36 Questions
Exam 17: Time Series Analysis and Forecasting47 Questions
Exam 18: Nonparametric Methods18 Questions
Exam 19: Statistical Methods for Quality Control51 Questions
Exam 20: Decision Analysis29 Questions
Exam 21: Sample Survey33 Questions
Select questions type
The height and weight are recorded by the school nurse for every student in a school. What type of graph would best display the relationship between height and weight?
(Multiple Choice)
4.9/5  (31)
(31)
What type of relationship is depicted in the following scatter diagram? 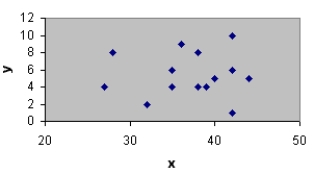
(Essay)
4.9/5 (35)
College students were surveyed to determine how much they planned to spend in various categories during the upcoming academic year. One category is the amount spent on school supplies. The graphs below show the amount of money spent on school supplies by women and men. 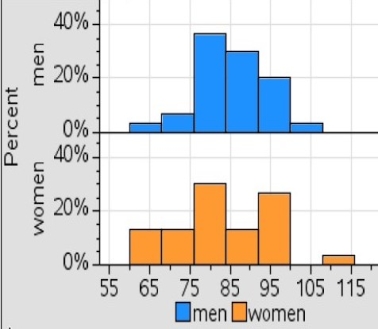 Approximately what percent of women spend more than $105 on school supplies?
(Multiple Choice)
4.9/5 (39)
You are given the following data on the ages of employees at a company. Construct a stem-and-leaf display. Specify the leaf unit for the display. 26 32 28 45 58 52 44 36 42 27 41 53 55 48 32 42 44 40 36 37
(Essay)
4.8/5 (34)
When the conclusions based upon the aggregated crosstabulation can be completely reversed if we look at the unaggregated data, the occurrence is known as _____.
(Multiple Choice)
4.7/5 (28)
The minimum number of variables represented in a bar chart is _____.
(Multiple Choice)
4.8/5 (34)
A researcher asked 20 people for their zip code. The respondents zip codes are an example of _____.
(Multiple Choice)
4.8/5 (31)
Data that provide labels or names for groupings of like items are known as _____.
(Multiple Choice)
4.8/5 (29)
Filters
- Essay(0)
- Multiple Choice(0)
- Short Answer(0)
- True False(0)
- Matching(0)