Exam 2: Descriptive Statistics: Tabular and Graphical Displays
Exam 1: Data and Statistics66 Questions
Exam 2: Descriptive Statistics: Tabular and Graphical Displays69 Questions
Exam 3: Descriptive Statistics: Numerical Measures103 Questions
Exam 4: Introduction to Probability86 Questions
Exam 5: Discrete Probability Distributions68 Questions
Exam 6: Continuous Probability Distributions74 Questions
Exam 7: Sampling and Sampling Distributions85 Questions
Exam 8: Interval Estimation115 Questions
Exam 9: Hypothesis Tests81 Questions
Exam 10: Inference About Means and Proportions With Two Populations21 Questions
Exam 11: Inferences About Population Variances72 Questions
Exam 12: Tests of Goodness of Fit, Independence, and Multiple Proportions37 Questions
Exam 13: Experimental Design and Analysis of Variance120 Questions
Exam 14: Simple Linear Regression64 Questions
Exam 15: Multiple Regression43 Questions
Exam 16: Regression Analysis: Model Building36 Questions
Exam 17: Time Series Analysis and Forecasting47 Questions
Exam 18: Nonparametric Methods18 Questions
Exam 19: Statistical Methods for Quality Control51 Questions
Exam 20: Decision Analysis29 Questions
Exam 21: Sample Survey33 Questions
Select questions type
Excel's Chart Tools does NOT have a chart type for constructing a _____.
(Multiple Choice)
4.8/5  (34)
(34)
In Excel, the line of best fit for the points in a scatter diagram is called a _____.
(Multiple Choice)
4.7/5 (36)
We ask 30 people the following question: "How many people do you live with?" Below are the results in a dot plot. 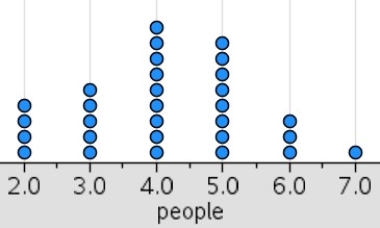 What percentage of people surveyed live with 3 or less people?
(Multiple Choice)
4.9/5 (41)
The sum of frequencies for all classes will always equal _____.
(Multiple Choice)
4.8/5 (33)
A graphical device for depicting categorical data that have been summarized in a frequency distribution, relative frequency distribution, or percent frequency distribution is a(n) _____.
(Multiple Choice)
4.9/5 (27)
A graphical device for presenting categorical data summaries based on subdivision of a circle into sectors that correspond to the relative frequency for each class is a _____.
(Multiple Choice)
4.8/5 (35)
The minimum number of variables represented in a histogram is _____.
(Multiple Choice)
4.9/5 (36)
A researcher is gathering data from four geographical areas designated: South = 1; North = 2; East = 3; West = 4. The designated geographical regions represent _____.
(Multiple Choice)
4.7/5 (23)
A common graphical presentation of quantitative data is a _____.
(Multiple Choice)
4.8/5 (41)
In constructing a frequency distribution, as the number of classes is decreased, the class width _____.
(Multiple Choice)
4.9/5 (31)
In a cumulative frequency distribution, the last class will always have a cumulative frequency equal to _____.
(Multiple Choice)
4.8/5 (39)
Before drawing any conclusions about the relationship between two variables shown in a crosstabulation, you should _____.
(Multiple Choice)
4.9/5 (33)
Do males prefer a particular type of smartphone more than females? A survey was conducted to help answer this question. The results are displayed below. 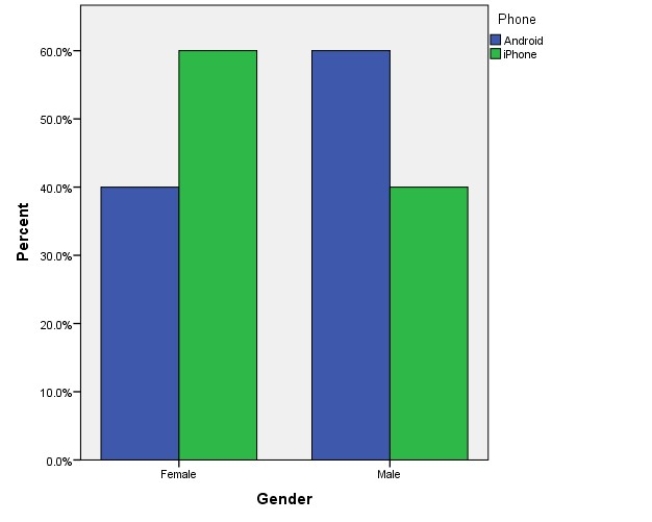 What type of phone do males prefer?
(Multiple Choice)
4.7/5 (41)
The grades of 10 students on their first management test are shown below. 94 61 96 66 92 68 75 85 84 78
a.
Construct a frequency distribution. Let the first class be 60−69.
b.
Construct a cumulative frequency distribution.
c.
Construct a relative frequency distribution.
(Essay)
4.8/5 (35)
A tabular method that can be used to summarize the data on two variables simultaneously is called _____.
(Multiple Choice)
4.8/5 (34)
A __________ can be used to graphically present quantitative data.
(Multiple Choice)
4.7/5 (28)
The frequency distribution below was constructed from data collected from a group of 25 students. Height (inches) Frequency 58-63 3 64-69 5 70-75 2 76-81 6 82-87 4 88-93 3 94-99 2
a.
Construct a relative frequency distribution.
b.
Construct a cumulative frequency distribution.
c.
Construct a cumulative relative frequency distribution.
(Essay)
4.9/5 (36)
You are given the following data on the annual salaries for 8 employees. Construct a stem-and-leaf display. Specify the leaf unit for the display. \ 26,500 \ 27,850 \ 25,000 \ 27,460 \ 26,890 \ 25,400 \ 26,150 \ 30,000
(Essay)
4.7/5 (40)
The proper way to construct a stem-and-leaf display for the data set {62, 67, 68, 73, 73, 79, 91, 94, 95, 97} is to _____.
(Multiple Choice)
4.9/5 (27)
Filters
- Essay(0)
- Multiple Choice(0)
- Short Answer(0)
- True False(0)
- Matching(0)