Exam 1: Stats Start Here
Exam 1: Stats Start Here115 Questions
Exam 2: Data150 Questions
Exam 3: Displaying and Describing Categorical Data110 Questions
Exam 4: Displaying and Comparing Qualitative Data84 Questions
Exam 5: Understanding and Comparing Distributions103 Questions
Exam 6: The Standard Deviation As a Ruler and the Normal Model74 Questions
Exam 7: Scatterplots, Association, and Correlation40 Questions
Select questions type
Which is true of the data whose distribution is shown?
I. The distribution is skewed to the right.
II. The mean is probably smaller than the median.
III. We should summarize with mean and standard deviation. 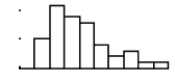
(Multiple Choice)
4.8/5  (32)
(32)
A statistics teacher gave her class a 15 point quiz. The summary statistics for the students'scores are shown in the table at the right.
10.95 points s 2.481 points min 4 Q1 9.5 median 12 Q3 12 max 15
a. Notice that the median score and the third quartile are the same. Explain how this can be.
b. One student's parent heaped praise on him for scoring 13, saying it was an amazing score. Comment on whether that praise is deserved using the summary statistics as support.
c. To convert these raw scores to a score out of 100, the teacher multiplies each score by six,then adds 10. (We can debate the wisdom of such a strategy later!). What is the median converted score? And the IQR?
d. What are the mean and standard deviation of the converted test scores?
(Essay)
4.8/5 (32)
A research company frequently monitors trends in the use of social media by American Adults. The results of one survey of 1846 randomly selected adults looked at social media use versus age group. The table summarizes the survey results.
start text Uses Social Media end text 18-29 30-49 50-64 65+ Total Yes 328 417 288 114 No 67 125 265 242 Total
-Identify the variables and tell whether each is categorical or quantitative.
(Essay)
4.7/5 (38)
Hardwood mulch Hardwood mulch is sold by the cubic yard. (But they just call it 'yards' to be confusing.) One lawn and garden store has a truck that they say can carry up to 7 yards for delivery. (It can actually hold a bit more.) Of course, when they fill the truck they don't get exactly 7 yards of mulch. They weigh it to determine the actual amount for billing purposes. They charge $28 per yard for the mulch, plus $25 for delivery.
a. Shown are some summary statistics describing the distribution of the actual amounts of mulch in full loads. Fill in the table to include those statistics for the cost including delivery.
Statistic Yards Cost incl. Of Mulch Delivery Mean 7.1 Standard deviation 0.18 Q1 6.8 Median 7.2 IQR 0.5
b. Your delivery is among this set of data, and it has a z-score of -0.84 for the distribution of yards of mulch. What is your z-score for the cost including delivery?
(Essay)
4.8/5 (42)
In order to plan transportation and parking needs at a private high school, administrators asked students how they get to school. Some rode a school bus, some rode in with parents or friends, and others used "personal" transportation - bikes, skateboards, or just walked. The table summarizes the responses from boys and girls.
Male Female Total Bus 30 34 Ride 37 45 Personal 19 23 Total
-Find each percent.
a. What percent of the students are girls who ride the bus?
b. What percent of the girls ride the bus?
c. What percent of the bus riders are girls?
(Short Answer)
4.7/5 (33)
In order to plan transportation and parking needs at a private high school, administrators asked students how they get to school. Some rode a school bus, some rode in with parents or friends, and others used "personal" transportation - bikes, skateboards, or just walked. The table summarizes the responses from boys and girls. Male Female Total Bus 30 34 Ride 37 45 Personal 19 23 Total
-Which of the W's are unknown for these data?
(Essay)
4.9/5 (45)
To determine if people's preference in dogs had changed in the recent years, organizers of a local dog show asked people who attended the show to indicate which breed was their favorite. This information was compiled by dog breed and gender of the people who responded. The table summarizes the responses. Female Male Total Yorkshire Terrier 73 59 Dachshund 49 47 Golden Retriever 58 33 Labrador 37 41 Dalmatian 45 28 Other breeds 86 67 Total
-Write a sentence or two about the conditional relative frequency distribution of the breeds among female respondents.
(Essay)
4.9/5 (39)
We might choose to display data with a stemplot rather than a boxplot because a stemplot
I. reveals the shape of the distribution.
II. is better for large data sets. III. displays the actual data.
(Multiple Choice)
4.9/5 (39)
The standard deviation of the data displayed in this dotplot is closest to… 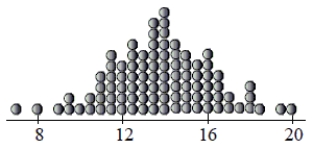
(Multiple Choice)
4.8/5 (42)
Cellphones ConsumerReports.org evaluated the price and performance of 99 models of cellphones. Computer output gives these summaries for the prices:
Min Q1 Median Q3 Max MidRange Mean TrMean SD 0 0 50 200 400 200 96.36 90.21 107.23
a. Were any of the prices outliers? Explain how you made your decision.
b. One of the manufacturers advertises a cellphone "economy-priced at only $31.95". Would you consider that to be a very low price? Explain.
(Essay)
4.8/5 (37)
A research company frequently monitors trends in the use of social media by American Adults. The results of one survey of 1846 randomly selected adults looked at social media use versus age group. The table summarizes the survey results.
start text Uses Social Media end text 18-29 30-49 50-64 65+ Total Yes 328 417 288 114 No 67 125 265 242 Total
-Do you think social media use is independent of age? Give statistical evidence to support your conclusion.
(Essay)
4.9/5 (38)
To determine if people's preference in dogs had changed in the recent years, organizers of a local dog show asked people who attended the show to indicate which breed was their favorite. This information was compiled by dog breed and gender of the people who responded. The table summarizes the responses.
Female Male Total Yorkshire Terrier 73 59 Dachshund 49 47 Golden Retriever 58 33 Labrador 37 41 Dalmatian 45 28 Other breeds 86 67 Total
-Find each percent.
a. What percent of the responses were from males who favor Labradors?
b. What percent of the male responses favor Labradors?
c. What percent of the people who choose Labradors were males?
(Short Answer)
4.8/5 (30)
The body temperature of students is taken each time a student goes to the nurse's office.
The five-number summary for the temperatures (in degrees Fahrenheit) of students on a particular day is:
Min Q1 Median Q3 Max 96. 97.8 98.2 98. 101.
a. Would you expect the mean temperature of all students who visited the nurse's office to be higher or lower than the median? Explain.
b. After the data were picked up in the afternoon, three more students visited the nurse's office with temperatures of 96.7°, 98.4°, and 99.2°. Were any of these students outliers? Explain.
(Essay)
4.8/5 (38)
Suppose a Normal model describes the number of pages printer ink cartridges last. If we keep track of printed pages for the 47 printers at a company's office, which must be true?
I. The page counts for those ink cartridges will be normally distributed. II. The histogram for those page counts will be symmetric.
III. 95% of those page counts will be within 2 standard deviations of the mean.
(Multiple Choice)
4.8/5 (42)
Which is true of the data shown in the histogram?
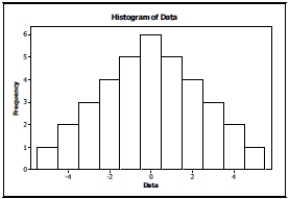 I. The distribution is approximately symmetric.
II. The mean and median are approximately equal.
III. The median and IQR summarize the data better than the mean and standard deviation.
I. The distribution is approximately symmetric.
II. The mean and median are approximately equal.
III. The median and IQR summarize the data better than the mean and standard deviation.
(Multiple Choice)
4.9/5 (33)
The boxplots show prices of used cars (in thousands of dollars) advertised for sale at three different car dealers. 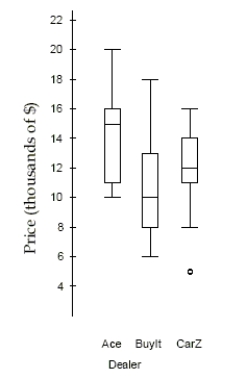 a. Which dealer offers the cheapest car offered, and at what price? b. Which dealer has the lowest median price, and how much is it? c. Which dealer has the smallest price range, and what is it?
d. Which dealer's prices have the smallest IQR, and what is it?
e. Which dealer generally sells cars cheapest? Explain.
a. Which dealer offers the cheapest car offered, and at what price? b. Which dealer has the lowest median price, and how much is it? c. Which dealer has the smallest price range, and what is it?
d. Which dealer's prices have the smallest IQR, and what is it?
e. Which dealer generally sells cars cheapest? Explain.
(Essay)
4.7/5 (27)
A research company frequently monitors trends in the use of social media by American Adults. The results of one survey of 1846 randomly selected adults looked at social media use versus age group. The table summarizes the survey results.
start text Uses Social Media end text 18-29 30-49 50-64 65+ Total Yes 328 417 288 114 No 67 125 265 242 Total
-Find each percent.
a) What percent of adults surveyed are social media users aged 30-49?
b) What percent of the social media users are aged 30-49?
c) What percent of adults aged 30-49 are social media users?
(Short Answer)
4.8/5 (34)
Copy machines A manufacturer claims that lifespans for their copy machines (in months)can be described by a Normal model N(42, 7). Show your work.
a. Draw and clearly label the model. 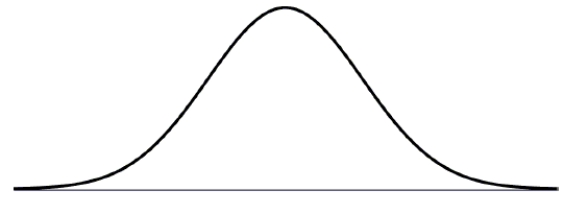 b. A company with several large office buildings buys 200 of these copiers. The salesman tells the boss "190 (95%) of your new copiers will last between and months." Comment on this claim.
c. What is the 3rd quartile of copier lifespans?
d. What percent of the copiers are expected to fail before 36 months?
e. The manufacturer wants to reduce the 36-month failure rate to only 10%. Assuming the mean lifespan will stay the same, what standard deviation must they achieve?
f. Briefly explain what that change in standard deviation means in this context.
g. A competing manufacturer says that not only will 90% of their copiers last at least 36 months, 65% will last at least 42 months. What Normal model parameters is that manufacturer claiming? Show your work. N( , )
b. A company with several large office buildings buys 200 of these copiers. The salesman tells the boss "190 (95%) of your new copiers will last between and months." Comment on this claim.
c. What is the 3rd quartile of copier lifespans?
d. What percent of the copiers are expected to fail before 36 months?
e. The manufacturer wants to reduce the 36-month failure rate to only 10%. Assuming the mean lifespan will stay the same, what standard deviation must they achieve?
f. Briefly explain what that change in standard deviation means in this context.
g. A competing manufacturer says that not only will 90% of their copiers last at least 36 months, 65% will last at least 42 months. What Normal model parameters is that manufacturer claiming? Show your work. N( , )
(Essay)
4.9/5 (25)
At HYPERLINK "http://www.census.gov/" www.census.gov you can create a "population pyramid" for any country. These pyramids are back-to-back histograms. This pyramid shows Mexico's 2000 female population and the census bureau's projection for 2050. Write a few sentences summarizing the changes that are forecast. 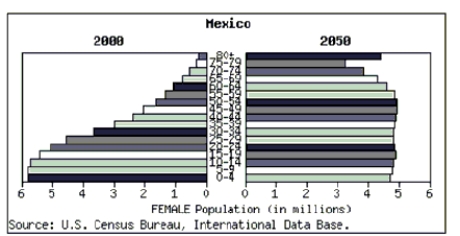
(Essay)
4.9/5 (40)
Paying for purchases One day a store tracked the way shoppers paid for their purchases.
Their data are summarized in the table. Cash Check Charge Total Male 18 10 12 40 Female 18 12 30 60 Total 36 22 42 100
a. What percent of the men paid cash?
b. What is the conditional relative frequency distribution of payment method for women?
c. If you wanted to show the association between gender and method of payment visually, what kind of graph would you make? (Just name it.)
d. Is there evidence of an association between gender and method of payment? Explain briefly.
(Essay)
4.7/5 (38)
Filters
- Essay(0)
- Multiple Choice(0)
- Short Answer(0)
- True False(0)
- Matching(0)