Exam 1: Stats Start Here
Exam 1: Stats Start Here115 Questions
Exam 2: Data150 Questions
Exam 3: Displaying and Describing Categorical Data110 Questions
Exam 4: Displaying and Comparing Qualitative Data84 Questions
Exam 5: Understanding and Comparing Distributions103 Questions
Exam 6: The Standard Deviation As a Ruler and the Normal Model74 Questions
Exam 7: Scatterplots, Association, and Correlation40 Questions
Select questions type
The advantage of making a stem-and-leaf display instead of a dotplot is that a stem-and-leaf display
(Multiple Choice)
4.8/5  (32)
(32)
Which is true of the data shown in the histogram?
I. The distribution is skewed to the right.
II. The mean is probably smaller than the median.
III. We should use median and IQR to summarize these data. 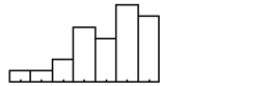
(Multiple Choice)
4.9/5 (36)
The boxplots show the age of people involved in accidents according to their role in the accident. 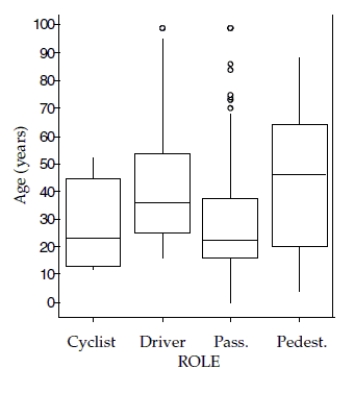 a. Which role involved the youngest person, and what is the age?
b. Which role had the lowest median age, and what is the age?
c. Which role had smallest range of ages, and what is it?
d. Which role had the largest IQR of ages, and what is it?
e. Which role generally involved the oldest people? Explain.
a. Which role involved the youngest person, and what is the age?
b. Which role had the lowest median age, and what is the age?
c. Which role had smallest range of ages, and what is it?
d. Which role had the largest IQR of ages, and what is it?
e. Which role generally involved the oldest people? Explain.
(Essay)
4.9/5 (38)
Write a sentence or two about the conditional relative frequency distribution of modes of transportation for the boys.
(Essay)
4.9/5 (28)
Has the percentage of young girls drinking milk changed over time? The following table is consistent with the results from "Beverage Choices of Young Females: Changes and Impact on Nutrient Intakes
start text Drinks Fluid Milk end text 1987-1988 1989-1991 1994-1996 Total Yes 354 502 366 No 226 335 366 Total
-Consider the following pie charts of a subset of the data above: 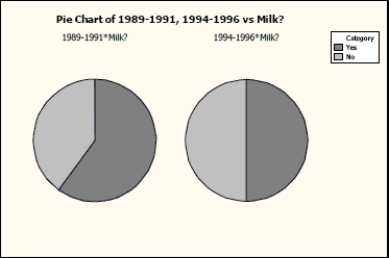 Do the pie charts above indicate that milk consumption by young girls is independent of the nationwide survey year? Explain.
(Essay)
4.9/5 (43)
Auto insurance The Insurance Institute for Highway Safety publishes ratings for all models of vehicles to compare the relative risk of payouts. 100 is the mean rating for all vehicles. A rating of 122 means the vehicle is 22% worse than average. The table shows the summary statistics for the collision ratings of 27 midsize cars.
Min 57 Q1 99 Median 109 Q3 122 Max 173 Mean 110.9 SD 23.99
a. Were any of the ratings outliers? Show how you made your decision.
b. A histogram of the data is shown. Is it more appropriate to use the mean and standard
deviation, or the median and IQR to describe these data? Explain. 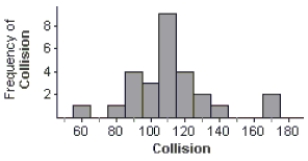
(Essay)
4.8/5 (38)
Which of these variables is most likely to follow a Normal model for U.S. adults?
(Multiple Choice)
4.8/5 (32)
To determine if people's preference in dogs had changed in the recent years, organizers of a local dog show asked people who attended the show to indicate which breed was their favorite. This information was compiled by dog breed and gender of the people who responded. The table summarizes the responses.
Female Male Total Yorkshire Terrier 73 59 Dachshund 49 47 Golden Retriever 58 33 Labrador 37 41 Dalmatian 45 28 Other breeds 86 67 Total
-What is the marginal distribution of breeds?
(Essay)
4.8/5 (41)
Last weekend police ticketed 18 men whose mean speed was 72 miles per hour, and 30 women going an average of 64 mph. Overall, what was the mean speed of all the people ticketed?
(Multiple Choice)
4.8/5 (37)
Light bulbs are measured in lumens (light output), watts (energy used), and hours (life). A standard white light bulb has a mean life of 675 hours and a standard deviation of 50 hours. A soft white light bulb has a mean life of 700 hours and a standard deviation of 35
hours. In a test at a local science competition, both light bulbs lasted 750 hours. Which light bulb's life span was better? Explain.
(Essay)
4.8/5 (30)
The five-number summary for midterm scores (number of points; the maximum possible score was 50 points) from an intro stats class is:
Min Q 1 Median Q 3 Max 16.5 32 39 43.5 48.5
a. Would you expect the mean midterm score of all students who took the midterm to be higher or lower than the median? Explain.
b. Based on the five-number summary, are any of the midterm scores outliers? Explain.
(Essay)
4.9/5 (34)
A brake and muffler shop reported the repair bills, in dollars, for their customers yesterday.
88 283 312 290 172 154 400 381 346 181 203 118 143 252 227 56 192 292 213 422
a. Sketch a histogram for these data.
b. Find the mean and standard deviation of the repair costs.
c. Is it appropriate to use the mean and standard deviation to summarize these data?Explain.
d. Describe the distribution of repair costs.
(Essay)
5.0/5 (39)
In order to plan transportation and parking needs at a private high school, administrators asked students how they get to school. Some rode a school bus, some rode in with parents or friends, and others used "personal" transportation - bikes, skateboards, or just walked. The table summarizes the responses from boys and girls.
Male Female Total Bus 30 34 Ride 37 45 Personal 19 23 Total
-Do you think mode of transportation is independent of gender? Give statistical evidence to support your conclusion.
(Essay)
4.9/5 (39)
Suppose that a Normal model described student scores in a history class. Parker has a standardized score (z-score) of +2.5. This means that Parker
(Multiple Choice)
4.8/5 (36)
Salary conversions You learn that your company is sending you and several other employees to staff a new office in China. While there everyone will earn the equivalent of their current salary, converted to Chinese currency at the rate of 8 yuans per dollar. In addition, everyone will earn a weekly foreign living allowance of 200 yuans. For example, since you are earning $1000 per week, your weekly salary in China will be
1000 × 8 + 200 = 8200 yuans.
a. Shown are some summary statistics describing the current salaries of this group being sent overseas. Fill in the table to show what these statistics will be for the salaries you all will earn while in China.
Statistic In the US In China Minimum salary \ 400 Standard deviation \ 250 Median \ 750 IQR \ 300
b. Among this group of employees going to China, your US salary has a z-score of +1.20. What will your new z-score be, based on everyone's China salary?
(Short Answer)
4.8/5 (39)
Your Stats teacher tells you your test score was the 3rd quartile for the class. Which is true?
I. You got 75% on the test.
II. You can't really tell what this means without knowing the standard deviation.
III. You can't really tell what this means unless the class distribution is nearly Normal.
(Multiple Choice)
4.9/5 (39)
The average scores for Wisconsin schools on the ACT are summarized in the ogive shown. Estimate the IQR of the average scores. 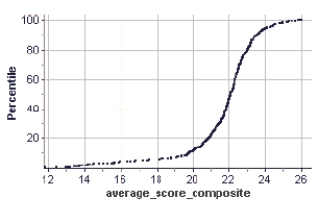
(Multiple Choice)
4.8/5 (32)
Commuting to work The table shows how a company's employees commute to work. Transportation Job Class Car Bus Train Total Management 26 20 44 90 Labor 56 106 168 330 Total 82 126 212 420
a. What is the marginal distribution (in %) of mode of transportation? Car Bus _ Train
b. What is the conditional distribution (in %) of mode of transportation for management? Car Bus Train
c. What kind of display would you use to show the association between job class and mode of transportation? (Just name a graph.)
d. Do job classification and mode of transportation appear to be independent? Give statistical evidence to support your conclusion.
(Essay)
4.9/5 (38)
The students in a biology class kept a record of the height (in centimeters) of plants for a class experiment.
49 67 38 55 62 54 36 41 56 43 48 75 44 60 48 52 48 53 59 32
a. Sketch a histogram for these data.
b. Find the mean and standard deviation of the plant heights.
c. Is it appropriate to use the mean and standard deviation to summarize these data? Explain.
d. Describe the distribution of plant heights.
(Essay)
4.8/5 (32)
A professor has kept records on grades that students have earned in his class. If he wants to examine the percentage of students earning the grades A, B, C, D, and F during the most recent term, which kind of plot could he make?
(Multiple Choice)
4.8/5 (35)
Filters
- Essay(0)
- Multiple Choice(0)
- Short Answer(0)
- True False(0)
- Matching(0)