Exam 1: Stats Start Here
Exam 1: Stats Start Here115 Questions
Exam 2: Data150 Questions
Exam 3: Displaying and Describing Categorical Data110 Questions
Exam 4: Displaying and Comparing Qualitative Data84 Questions
Exam 5: Understanding and Comparing Distributions103 Questions
Exam 6: The Standard Deviation As a Ruler and the Normal Model74 Questions
Exam 7: Scatterplots, Association, and Correlation40 Questions
Select questions type
Soft drinks A restaurant owner wanted to improve the efficiency of his employees. One way he tried to do this was to buy a machine that will automatically dispense 16 oz. of soda into a glass rather than have the employee hold the button on the dispenser. The actual amount dispensed by the machine can be represented by the model N(16.2, 0.3)
a. Draw and clearly label the model. 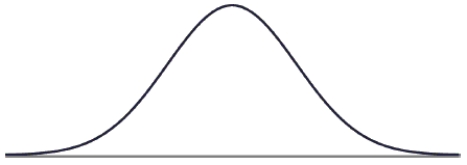 b. The sales representative who sold him the machine said, "95% of the glasses you fill with soda will fall between and ." Fill in the blanks based on the normal model, then comment on this claim.
c. What is the 3rd quartile of amounts dispensed?
d. If a glass will actually hold 16.7 oz. of soda, what percent of the time would you expect the glass to overflow?
e. The manufacturer wants to reduce the overflow rate to only 1%. Assuming the mean amount dispensed will stay the same, what standard deviation must they achieve?
f. Briefly explain what that change in standard deviation means in this context.
g. A competing manufacturer says that not only will 98% of their glasses be safe from overflowing, but 70% will have more than 16 oz., reducing customer complaints. What Normal model parameters is that manufacturer claiming? Show your work. N( , )
b. The sales representative who sold him the machine said, "95% of the glasses you fill with soda will fall between and ." Fill in the blanks based on the normal model, then comment on this claim.
c. What is the 3rd quartile of amounts dispensed?
d. If a glass will actually hold 16.7 oz. of soda, what percent of the time would you expect the glass to overflow?
e. The manufacturer wants to reduce the overflow rate to only 1%. Assuming the mean amount dispensed will stay the same, what standard deviation must they achieve?
f. Briefly explain what that change in standard deviation means in this context.
g. A competing manufacturer says that not only will 98% of their glasses be safe from overflowing, but 70% will have more than 16 oz., reducing customer complaints. What Normal model parameters is that manufacturer claiming? Show your work. N( , )
(Essay)
4.8/5  (42)
(42)
There is a proposal to replace the shortest roller coaster above with one that has a length of 1,200 ft. Indicate whether changing that roller coaster's length would make each of these summary statistics increase, decrease, or stay about the same.
a. mean
b. median
c. range
d. IQR
e. standard deviation
(Essay)
4.8/5 (41)
All students in a physical education class completed a basketball free-throw shooting event and the highest number of shots made was 32. The next day a student who had just transferred into the school completed the event, making 35 shots. Indicate whether adding the new student's score to the rest of the data made each of these summary statistics increase, decrease, or stay about the same.
a. mean
b. median c. range
d. IQR
e. standard deviation
(Short Answer)
4.8/5 (34)
Has the percentage of young girls drinking milk changed over time? The following table is consistent with the results from "Beverage Choices of Young Females: Changes and Impact on Nutrient Intakes" (Shanthy A. Bowman, Journal of the American Dietetic Association, 102(9), pp. 1234-1239):
start text Drinks Fluid Milk end text 1987-1988 1989-1991 1994-1996 Total Yes 354 502 366 No 226 335 366 Total
-What is the marginal distribution of milk consumption?
(Short Answer)
4.8/5 (31)
A research company frequently monitors trends in the use of social media by American Adults. The results of one survey of 1846 randomly selected adults looked at social media use versus age group. The table summarizes the survey results.
start text Uses Social Media end text 18-29 30-49 50-64 65+ Total Yes 328 417 288 114 No 67 125 265 242 Total
-Write a sentence or two about the conditional relative frequency distribution of ages of social media users.
(Essay)
4.8/5 (37)
The lifespans of a particular brand of graphing calculator are approximately normally distributed with a mean of 620 days from the purchase date and a standard deviation of 82 days. They will provide a warranty that guarantees a replacement if the calculator stops working within the specified time frame, and are trying to decide what time frame to use. a. If the company sets the warranty at a year and a half (say 540 days), what proportion of calculators will they have to replace?
b. The company does not want to have to replace more than 1% of the calculators they sell. What length of time should they set for the warranty?
c. The company would like to set the warranty for 540 days, and still replace no more than
1% of the calculators sold. Increasing the average life of the calculators is too expensive, but
they think they reduce the standard deviation of the lifespans. What standard deviation of lifespans would be needed to make this happen?
d. Explain what achieving a smaller standard deviation means in this context.
(Essay)
4.9/5 (38)
Has the percentage of young girls drinking milk changed over time? The following table is consistent with the results from "Beverage Choices of Young Females: Changes and Impact on Nutrient Intakes" (Shanthy A. Bowman, Journal of the American Dietetic Association, 102(9), pp. 1234-1239):
start text Drinks Fluid Milk end text 1987-1988 1989-1991 1994-1996 Total Yes 354 502 366 No 226 335 366 Total
-Find the following:
a. What percent of the young girls reported that they drink milk?
b. What percent of the young girls were in the 1989-1991 survey?
c. What percent of the young girls who reported that they drink milk were in the 1989-1991 survey?
d. What percent of the young girls in 1989-1991 reported that they drink milk?
(Short Answer)
4.7/5 (42)
Health Insurance The World Almanac and Book of Facts 2004 reported the percent of people not covered by health insurance in the 50 states and Washington, D.C., for the year 2002. Computer output gives these summaries for the percent of people not covered by health insurance:
Min Q1 Median Q3 Max Mean SD 7.9 10.8 13.4 16.7 25.8 13.9 3.6
a. Were any of the states outliers? Explain how you made your decision. b. A histogram of the data is as follows: 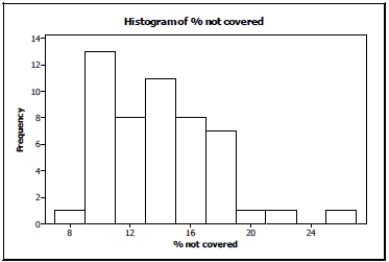 Is it more appropriate to use the mean and standard deviation or the median and IQR to describe these data? Explain.
(Essay)
4.8/5 (38)
Which type of plot would be most appropriate to display the responses to type of residence?
(Multiple Choice)
4.8/5 (41)
During a budget meeting, local school board members decided to review class size information to
determine if budgets were correct. Summary statistics are shown in the table.
33.39 students s 5.66 students min 17 Q1 29 median 33 Q3 40 max 40
a. Notice that the third quartile and maximum class sizes are the same. Explain how this can be.
b. The school district declares that classes with fewer than 20 students are "too small". Would you consider a class of 20 students to be unusually small? Explain.
c. The school district sets the office supply budgets of their high schools on the enrollment of students. The district budgets each class $12 plus $0.75 per student, so a class with one student receives $12.75 and the classes with 40 students receive 12 + 0.75(40) = $42. What is the median class budget for office supplies? And the IQR?
d. What are the mean and standard deviation of the class office supply budgets?
(Essay)
4.8/5 (33)
Which variable about German Shepherds is most likely to be described by a Normal model?
(Multiple Choice)
4.8/5 (42)
Embryonic stem cells A Pew Research survey asked Americans their feelings on medical use of embryonic stem cells. Say they surveyed 340 people and got the results summarized in the table.
Morally Wrong Not A Moral Issue Morally Acceptable Total Conservative 36 33 30 99 Moderate 29 62 58 149 Liberal 14 42 36 92 Total 79 137 124 340
a. What percent of the moderates said it is morally acceptable?
b. What is the conditional relative frequency distribution of belief for for conservatives?
c. If you wanted to show the association between political affiliation and feelings toward medical use of embryonic stem cells, what kind of graph would you make? (Just name it.)
d. Is there evidence of an association between political affiliation and feelings toward medical use of embryonic stem cells? Explain briefly.
(Essay)
4.8/5 (34)
School administrators collect data on students attending the school. Which of the following variables is quantitative?
(Multiple Choice)
4.7/5 (31)
Do you think that milk consumption by young girls is independent of the nationwide survey year? Use statistics to justify your reasoning.
(Essay)
4.8/5 (30)
The SPCA collects the following data about the dogs they house. Which is categorical?
(Multiple Choice)
4.8/5 (45)
Filters
- Essay(0)
- Multiple Choice(0)
- Short Answer(0)
- True False(0)
- Matching(0)