Exam 15: Distribution-Free Procedures
Exam 1: Overview and Descriptive Statistics15 Questions
Exam 2: Probability16 Questions
Exam 3: Discrete Random Variables and Probability Distributions22 Questions
Exam 4: Continuous Random Variables and Probability Distributions17 Questions
Exam 5: Joint Probability Distributions and Random Samples19 Questions
Exam 6: Point Estimation28 Questions
Exam 7: Statistical Intervals Based on a Single Sample59 Questions
Exam 8: Tests of Hypotheses Based on a Single Sample92 Questions
Exam 9: Inferences Based on Two Samples73 Questions
Exam 10: The Analysis of Variance43 Questions
Exam 11: Multifactor Analysis of Variance62 Questions
Exam 12: Simple Linear Regression and Correlation106 Questions
Exam 13: Nonlinear and Multiple Regression77 Questions
Exam 14: Goodness-Of-Fit Tests and Categorical Data Analysis40 Questions
Exam 15: Distribution-Free Procedures66 Questions
Exam 16: Quality Control Methods86 Questions
Select questions type
Reports are available on a study in which various measurements were taken both from a random sample of infants who had been exposed to household smoke and from a sample of unexposed infants. The accompanying data consists of observations on urinary concentration of cotanine, a major metabolite of nicotine. Does the data suggest that "true" average cotanine level is higher in exposed infants than in unexposed infants by more than 25? Carry out a test at significance level l.05. Unexposed 8 11 12 14 20 43 111 Exposed 35 56 83 92 128 150 176 208
Free
(Essay)
5.0/5  (29)
(29)
Correct Answer: Verified
Let denote true average cotanine levels in unexposed and exposed infants, respectively. The hypotheses of interest are With m = 7, n = 8, will be rejected at level .05 if Before ranking, -25 is subtracted from each (i.e. 25 is added to each), giving 33, 36, 37, 39, 45, 68, and 136. The corresponding ranks in the combined set of 15 observations are 1, 3, 4, 5, 6, 8, and 12, from which w = 1 + 3 + … + 12 = 39. Because is rejected. The true average level for exposed infants appears to exceed that for unexposed infants by more than 25 (note that would not be rejected using level .01).
In a test to determine whether soil pretreated with small amounts of Basic-H makes the soil more permeable to water, soil samples were divided into blocks, and each block received each of the four treatment under study. The treatments were (A) water with .001% Basic-H flooded on control soil, (B) water without Basic-H on control soil, (C) water with Basic-H flooded on soil pretreated with Basic-H, and (D) water without Basic-H on soil pretreated with Basic-H. Test at level .01 to see whether there are any effects due to the different treatments.
Blocks 40.1 34.8 31.0 28.9 28.5 28.3 26.7 27.4 24.7 29.2 B 36.2 28.3 23.2 23.3 21.3 22.3 20.3 20.0 19.7 21.3 C 61.9 57.2 52.2 50.9 41.2 51.8 50.8 43.2 47.0 49.4 D 59.7 52.6 49.4 43.9 42.4 40.1 40.5 42.6 38.1 39.5
Free
(Essay)
4.7/5 (34)
Correct Answer:Verified
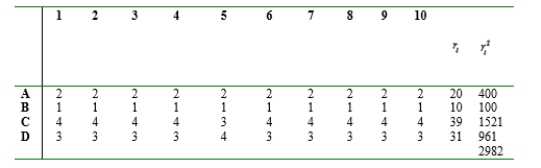 The computed value of which is
is rejected.
Which of the following statements are not true?
Free
(Multiple Choice)
4.8/5 (40)
Correct Answer:Verified
A
The observed value of the Wilcoxon Signed-Rank Test statistic is the sum of the ranks associated with the __________ observations.
(Short Answer)
4.9/5 (35)
Which of the following tests would be an example of a distribution-free procedure?
(Multiple Choice)
4.8/5 (36)
For n = 8 observations, there are __________ possible signed-rank sequences, and to list these sequences would be very tedious.
(Short Answer)
4.8/5 (37)
An alternative name for the Wilcoxon rank-sum test is the __________ test.
(Short Answer)
4.9/5 (38)
Because the t and F procedures require the distributional assumption of normality, they are not __________ procedures.
(Short Answer)
4.9/5 (34)
Which of the following tests would be an example of a nonparametric procedure?
(Multiple Choice)
4.9/5 (37)
The Wilcoxon rank-sum test statistic W is the sum of the ranks in the combined X and Y sample observations associated with __________ observations.
(Short Answer)
4.9/5 (36)
The nonparametric counterpart of the parametric single-factor ANOVA F-test is the
(Multiple Choice)
4.8/5 (33)
Which of the following distributions approximate the Kruskal-Wallis test statistic K when is true, and the number of populations or treatments I=3 and the sample sizes
(Multiple Choice)
4.8/5 (37)
The accompanying data on cortisol level was reported in a research paper. Experimental subjects were pregnant women whose babies were delivered between 38 and 42 weeks gestation. Group 1 individuals elected to deliver by Caesarean section before labor onset, group 2 delivered by emergency Caesarean during induced labor, and group 3 individuals experienced spontaneous labor. Use the Kruskal-Wallis test at level .05 to test for equality of the three population means. Group 1 267 312 216 328 459 344 309 159 292 361 Group 2 470 506 460 360 473 367 Group 3 348 777 212 1053 843 692
(Essay)
4.7/5 (43)
In an experiment designed to study the effects of illumination level on task performance, subjects were required to insert a fine-tipped probe into the eyeholes of ten needles in rapid succession both for a low light level with black background and a higher level with a white background. Each data value is the time (sec) required to complete the task.
Subject Black 28.85 31.84 35.05 28.74 23.89 44.05 28.01 27.96 30.47 White 21.23 23.84 25.96 22.68 22.50 27.98 19.61 19.07 27.59 Does the data indicate that the higher level of illumination yields a decrease of more than 5 sec in
true average task completion time? Test the appropriate hypotheses using the Wilcoxon test.
(Essay)
4.8/5 (34)
For large samples when the underlying population is normal, the Wilcoxon signed-rank interval will tend to be slightly __________ than the t interval.
(Short Answer)
4.9/5 (28)
The accompanying 25 observations on fracture toughness of base plate of 18% nickel maraging steel were obtained. Suppose a company will agree to purchase this steel for a particular application only if it can be strongly demonstrated from experimental evidence that "true" average toughness exceeds 80. Assuming that the fracture toughness distribution is symmetric, state and test the appropriate hypotheses level .05 and compute a P-value. 74.5 76.9 77.6 78.1 78.3 78.5 79.1 79.2 80.3 80.5 80.7 80.8 81.1 81.2 81.2 81.9 82.0 82.9 83.1 84.6 84.7 85.1 87.2 88.7 98.7
(Essay)
4.9/5 (44)
A random sample of size 24 is drawn from a continuous and symmetric probability distribution with mean In testing it can be shown that the Wilcoxon signed-rank test statistic has approximately a normal distribution with mean and standard deviation given, respectively, by
(Multiple Choice)
4.8/5 (42)
Filters
- Essay(0)
- Multiple Choice(0)
- Short Answer(0)
- True False(0)
- Matching(0)