Exam 10: Spreadsheet Models
Exam 1: Introduction49 Questions
Exam 2: Descriptive Statistics84 Questions
Exam 3: Data Visualization69 Questions
Exam 4: Descriptive Data Mining56 Questions
Exam 5: Probability: an Introduction to Modeling Uncertainty62 Questions
Exam 6: Statistical Inference62 Questions
Exam 7: Linear Regression71 Questions
Exam 8: Time Series Analysis and Forecasting58 Questions
Exam 9: Predictive Data Mining40 Questions
Exam 10: Spreadsheet Models64 Questions
Exam 11: Linear Optimization Models58 Questions
Exam 12: Integer Linear Optimization Models56 Questions
Exam 13: Nonlinear Optimization Models55 Questions
Exam 14: Monte Carlo Simulation59 Questions
Exam 15: Decision Analysis58 Questions
Select questions type
A company asked one of their analysis team to analyze and create models that help decide whether they should manufacture a particular product or outsource its production. The different components are given below.
Fixed Cost, FC = $25,000
Material Cost per Unit, MC = $2.15
Labor Cost per Unit, LC = $2.00
Outsourcing Cost per Unit, O = $4.50
Build a spreadsheet model and then use a two-way data table to show how the savings due to outsourcing changes as a function of different production volume and different bids on per-unit cost for outsourcing. Vary the production volume from 0 to 100,000 in increments of 10,000. The six bids are $3.11, $3.49, $4.50, $4.98, $5.12, and $5.45.
(Essay)
4.8/5  (40)
(40)
In _______________ decision making companies have to decide whether they should manufacture a product or outsource its production to another firm.
(Multiple Choice)
4.8/5 (31)
Which of the following tools provides an excellent means of identifying the exact location of an error in a formula?
(Multiple Choice)
4.9/5 (35)
The Gatson manufacturing company has estimated the following components for a new product.
Fixed cost = $50,000
Material cost per unit = $2.15
Labor cost per unit = $2.00
Revenue per unit = $7.50
Construct a spreadsheet model and then use use a two-way data table to show how the profit changes as a function of different production volumes and different values of material cost per unit. Vary the production volume from 0 to 100,000 in increments of 10,000. The five different material costs are $1.50, $1.95, $2.15, $2.85, and $3.25.
(Essay)
4.8/5 (38)
Which of the following would be a likely mathematical expression for Total Revenue? 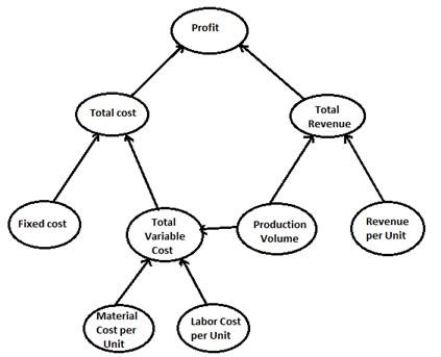
(Multiple Choice)
4.8/5 (40)
The average cost/unit for the production of a particular component at a manufacturing plant varies with the number of units produced in each batch. The data are given below.
Number of units produced Cost/unit 0-49 \ 37.72 50-100 \ 25.02
Suppose the selling price of each unit is $35.
Use a two-way data table to show how the profit changes as a function of demand and the selling price of the product. Vary the demand from 20 units to 80 units in increments of 10 units and selling price from $30 to $40 in increments of $2.
(Essay)
4.9/5 (39)
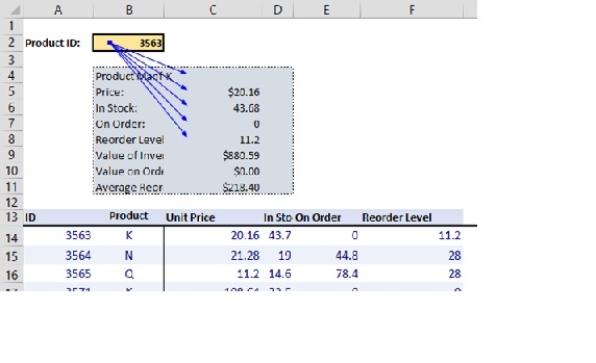
The following table is used to lookup information on a specific product. I chose to show the dependents of cell B2. How can I remove the arrows that are indicating the dependents?
(Essay)
4.8/5 (39)
Suppose a company supplies four of its products A, B, C, and D, to five different regions. The management wants to know the total number of all products supplied to each region as well as the total number of units of each product supplied. The data collected over a period of month are given below. Region Model Number of units Region 1 A 1784 Region 2 A 2170 Region 3 A 415 Region 4 A 2040 Region 5 A 2991 Region 1 B 947 Region 2 B 2111 Region 3 B 1234 Region 4 B 2061 Region 5 B 607 Region 1 C 2907 Region 2 C 4790 Region 3 C 2191 Region 4 C 1942 Region 5 C 220 Region 1 D 2557 Region 2 D 2980 Region 3 D 1518 Region 4 D 2957 Region 5 D 4462
Display your use of the SUMIF function and find the total volume by each region and total volume by each product.
(Essay)
4.8/5 (41)
The influence in an influence diagram is visually depicted by
(Multiple Choice)
5.0/5 (39)
Which of the following approaches is a good way to proceed with the influence diagram building for a problem?
(Multiple Choice)
4.8/5 (42)
Using the diagram below, which of the following would be a likely mathematical expression for Total Cost? 
(Multiple Choice)
4.9/5 (34)
The average cost/unit for the production of a particular component at a manufacturing plant varies with the number of units produced in each batch. The data are given below.
Number of Units Produced Cost/Unit 0-49 \ 37.72 50-100 \ 25.02
Suppose the selling price of each unit is $35.
a. Build a model to calculate the profit of the manufacturing industry if the demand is 20.
b. Construct a data table that shows the profit per unit as a function of demand if the demand ranges between 20 units through 80 units in increments of 10 units.
(Essay)
5.0/5 (45)
The following table is used to lookup information on a specific product. The Product ID is entered into the box and the information is returned in the green box. What would the lookup formula need to be in C8 to return the information for the Product named in B2.
(Short Answer)
5.0/5 (38)
The function of Trace Precedents and Trace Dependents is to
(Multiple Choice)
4.7/5 (38)
Using only "VLOOKUP", transfer all of the data from the table below into the "Individual Sales" table.
Individual Sales Rank Name Sales Team 6 Susan 5 red 8 Thomas 7 red 9 Lynn 2 blue 5 Sean 6 blue 1 Jerry 20 yellow 2 George 12 red 10 Elaine 1 red 7 Delores 4 blue 4 Tony 9 yellow 3 Art 12 blue Individual Sales Rank Name Sales Team 1 2 3 4 5 6 7 8 9 10
(Essay)
4.8/5 (45)
The ____________ button in the Formula Auditing group allows the user to inspect each formula in detail in its cell location.
(Multiple Choice)
4.8/5 (30)
An electronics store sells two models of television. The sales of these two models, X and Y, are dependent, that is, if the price of one increases, the demand for the other increases. A study is made to find the relationship between the demand (D) and the price (P) in order to maximize the revenue from these products. The result of the study is shown below.
DX = 476 - 0.54 PX + 0.22 PY
DY = 601 + 0.12 PX - 0.54 PY
a. Construct a model for the total revenue and implement it on a spreadsheet.
b. Develop a two-way data table to estimate the optimal prices of each of the two products in order to maximize the total revenue. Vary price of each product from $600 to $900 in increments of $50.
(Essay)
4.7/5 (39)
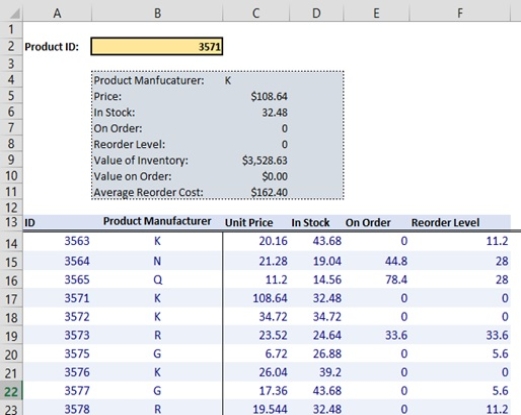
The following table is used to lookup information on a specific product. There are several formulas in the table. How could I look at all the formulas that reside in this worksheet?

(Short Answer)
4.8/5 (25)
An Excel _________________ quantifies the impact of changing the value of a specific input on an output of interest.
(Multiple Choice)
4.8/5 (40)
Filters
- Essay(0)
- Multiple Choice(0)
- Short Answer(0)
- True False(0)
- Matching(0)