Exam 7: Linear Regression
Exam 1: Introduction49 Questions
Exam 2: Descriptive Statistics84 Questions
Exam 3: Data Visualization69 Questions
Exam 4: Descriptive Data Mining56 Questions
Exam 5: Probability: an Introduction to Modeling Uncertainty62 Questions
Exam 6: Statistical Inference62 Questions
Exam 7: Linear Regression71 Questions
Exam 8: Time Series Analysis and Forecasting58 Questions
Exam 9: Predictive Data Mining40 Questions
Exam 10: Spreadsheet Models64 Questions
Exam 11: Linear Optimization Models58 Questions
Exam 12: Integer Linear Optimization Models56 Questions
Exam 13: Nonlinear Optimization Models55 Questions
Exam 14: Monte Carlo Simulation59 Questions
Exam 15: Decision Analysis58 Questions
Select questions type
A multiple regression model has for predicted heart rate is as follows: heart rate = 10 - 0.4 run speed + 12 body weight. As the run speed increases by 1 unit (holding body weight constant), heart weight is expected to increase by how much?
(Short Answer)
4.9/5  (31)
(31)
________________ is used to test the hypothesis that the values of the regression parameters B0, B1, B2, ... Bq are all zero.
(Multiple Choice)
4.8/5 (29)
A survey conducted by a research team was to investigate how the education level, tenure in current employment, and age, are related to annual income. A sample 20 employees is selected and the data is given below.
a. Determine the estimated multiple linear regression equation that can be used to predict
the annual income given number of years school completed (Education), length of tenure
in current employment, and age.
b. Use the F test to determine the overall significance of the regression relationship.What is the conclusion at the 0.05 level of significance?
(Essay)
4.9/5 (27)
Which of the following regression models is used to model a nonlinear relationship between the independent and dependent variables by including the independent variable and the square of the independent variable in the model?
(Multiple Choice)
4.9/5 (36)
A production company is studying the relationship between the average cost/unit and number of units produced in a batch. A sample of 10 batches is selected and the data is given below.
No. of units produced Cost/unit 20 37.7158 35 35.0158 50 30.8158 65 25.8158 80 20.0364 95 16.9064 110 16.3766 120 13.8564 135 13.9696 150 13.847
a. Develop an estimated quadratic regression equation for the data. How much variation in the sample values of cost/unit does this regression model explain?
b. Is the overall regression relationship significant at a 0.05 level of significance? If so, then test the relationship between the independent variable and the dependent variable at a 0.05 level of significance.
(Essay)
4.9/5 (39)
__________ is the data set used to build the candidate models.
(Multiple Choice)
4.8/5 (38)
A student is interested in studying the impact of number of books referred by students on a statistics course and the number of lectures they attended on the final grade on the course. A sample of 25 students is selected and the data is given below. BOOKS AT TEND GRADE 2 17 60 3 18 54 1 17 62 5 20 59 2 12 44 1 13 40 3 17 96 4 19 90 5 22 97 2 22 54 5 22 91 1 12 48 3 18 91 1 12 65 4 21 82 5 14 61 3 18 54 3 13 46 1 8 64 5 22 90
a. Use the F test to determine the overall significance of the relationship. What is your conclusion
at the 0.05 level of significance? Use the t test to determine the significance of each independent
variable? What are your conclusions at the 0.05 level of significance?
b. How much of the variation in the final grade does the model in part (a) explain?
(Essay)
4.8/5 (33)
The scatter chart below displays the residuals verses the dependent variable, x. Which of the following conclusions can be drawn based upon this scatter chart? 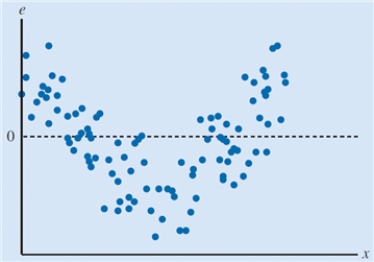
(Multiple Choice)
4.9/5 (41)
A research center is interested in investigating about height and age of children who are between 5 to 9 years old.
In order to do this, a sample of 15 children is selected and the data is given below. Age (in years) Height (inches) 7 47.3 8 48.8 5 41.3 8 50.4 8 51 7 47.1 7 46.9 7 48 9 51.2 8 51.2 5 40.3 8 48.9 6 45.2 5 41.9 8 49.6
a. Develop a scatter chart with age as the independent variable. What does the scatter chart indicate about the relationship between the height and age of children?
b. Use the data to develop an estimated regression equation that could be used to estimate the height based on the age. What is the estimated regression model?
c. How much of the variation in the sample values of height does the model estimated in part (b) explain?
(Essay)
4.9/5 (49)
Regression analysis involving one dependent variable and more than one independent variable is known as
(Multiple Choice)
4.8/5 (36)
In the simple linear regression model, the ____________ accounts for the variability in the dependent variable that cannot be explained by the linear relationship between the variables.
(Multiple Choice)
4.7/5 (32)
The scatter chart below displays the residuals verses the dependent variable, x. Which of the following conclusions can be drawn from the scatter chart given below? 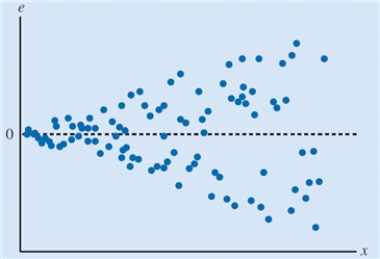
(Multiple Choice)
4.8/5 (35)
A researcher wanted to study effect of two factors, x1 and x2, on yield (y). The observations are given below. Observations 1 42.5 30.1 260.4 2 43.5 29.3 261.7 3 43.9 31.1 273.6 4 44.8 29.6 278.6 5 46.8 29.7 281.5 6 47.5 29.9 294.6 7 50.1 30.1 301.2 8 51.9 30.4 314.6 9 54.7 30.5 320.5 10 54.8 31 324.7 11 57.1 31.8 356.7 12 57.8 31.4 370.3 13 62.3 31.5 378 14 66.7 32.1 384.8 15 71.2 32.5 396.9
a. Develop an estimated regression equation with both factors x1 and x2 as the independent variables. Is the overall regression statistically significant at the 0.05 level of significance? If so, then test whether each of the regression parameters β0, β1, and β2 is equal to zero at a 0.01 level of significance. What are the correct interpretations of the estimated regression parameters?
b. How much of the variation in the sample values of y does the model in part (a) explain?
(Essay)
4.9/5 (36)
Give an estimated simple linear regression equation of = 46.2 + 589.2x with a coefficient of determination R^2 of 0.7523, interpret the coefficient of determination for this equation.
(Essay)
4.7/5 (38)
Prediction of the mean value of the dependent variable y for values of the independent variables x1, x2, . . . , xq that are outside the experimental range is called
(Multiple Choice)
4.7/5 (34)
A researcher wanted to study effect of two factors, x1 and x2, on yield (y). The observations are given below. Observations 1 42.5 30.1 260.4 2 43.5 29.3 261.7 3 43.9 31.1 273.6 4 44.8 29.6 278.6 5 46.8 29.7 281.5 6 47.5 29.9 294.6 7 50.1 30.1 301.2 8 51.9 30.4 314.6 9 54.7 30.5 320.5 10 54.8 31 324.7 11 57.1 31.8 356.7 12 57.8 31.4 370.3 13 62.3 31.5 378 14 66.7 32.1 384.8 15 71.2 32.5 396.9
a. Develop an estimated linear regression equation with the factor x1 as the independent variable.Test for a significant relationship between factor x1 and yield at the 0.05 level of significance.
b. How much of the variation in the sample values of yield does the model in part (a) explain?
(Essay)
4.9/5 (32)
The scatter chart below displays the residuals verses the dependent variable, t. Which of the following conclusions can be drawn based upon this scatter chart? 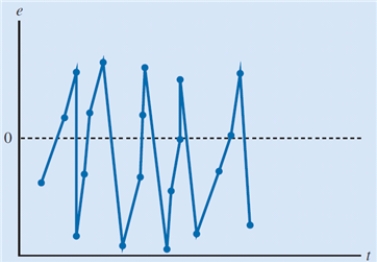
(Multiple Choice)
4.8/5 (44)
When the mean value of the dependent variable is independent of variation in the independent variable, the slope of the regression line is
(Multiple Choice)
4.9/5 (42)
Given the partial Excel output from a multiple regression, formulate the regression model.
Coefficients Standard Error Intercept 37,375.357 3,721.625 55.655 9.370 -5.750 3.575 3 0.213 0.373
(Short Answer)
4.8/5 (29)
The data listed below is the average personal income and personal consumption expenditures based on the survey
conducted in the year 1995 to 2009 in U.S. Personal income Personal consumption expenditures (\ ) 23,310 18,714 24,444 19,569 25,657 20,414 27,260 21,434 28,336 22,738 30,317 24,227 31,162 25,074 31,448 25,865 32,282 26,848 33,872 28,228 35,423 29,818 37,723 31,210 39,418 32,551 40,156 33,273 39,113 32,853
a. Develop a scatter chart for the above data. What does this chart indicate about the relationship between average
personal income and personal consumption expenditure?
b. Develop an estimated regression equation showing how personal consumption expenditure is related personal
income.
c. What proportion of variation in the sample values of proportion of personal consumption expenditure does this
model explain?
(Essay)
4.8/5 (31)
Filters
- Essay(0)
- Multiple Choice(0)
- Short Answer(0)
- True False(0)
- Matching(0)