Exam 2: Organizing and Visualizing Variables
Exam 1: Defining and Collecting Data204 Questions
Exam 2: Organizing and Visualizing Variables185 Questions
Exam 3: Numerical Descriptive Measures167 Questions
Exam 4: Basic Probability163 Questions
Exam 5: Discrete Probability Distributions216 Questions
Exam 6: The Normal Distribution and Other Continuous Distributions187 Questions
Exam 7: Sampling Distributions129 Questions
Exam 8: Confidence Interval Estimation189 Questions
Exam 9: Fundamentals of Hypothesis Testing: One-Sample Tests185 Questions
Exam 10: Two-Sample Tests212 Questions
Exam 11: Analysis of Variance210 Questions
Exam 12: Chi-Square and Nonparametric Tests175 Questions
Exam 13: Simple Linear Regression210 Questions
Exam 14: Introduction to Multiple Regression256 Questions
Exam 15: Multiple Regression Model Building67 Questions
Exam 16: Time-Series Forecasting168 Questions
Exam 17: Business Analytics113 Questions
Exam 18: A Roadmap for Analyzing Data325 Questions
Exam 19: Statistical Applications in Quality Management158 Questions
Exam 20: Decision Making123 Questions
Exam 21: Getting Started: Important Things to Learn First35 Questions
Exam 22: Binomial Distribution and Normal Approximation230 Questions
Select questions type
SCENARIO 2-5
The following are the duration in minutes of a sample of long-distance phone calls made within the continental United States reported by one long-distance carrier.
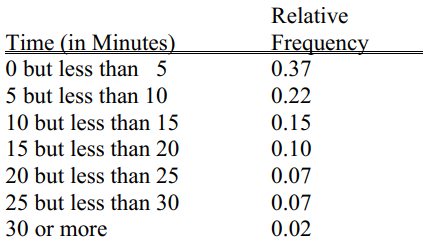 -Referring to Scenario 2-5,if 1,000 calls were randomly sampled,how many calls lasted under 10 minutes?
(Multiple Choice)
4.9/5  (28)
(28)
SCENARIO 2-17
The following table presents total retail sales in millions of dollars for the leading apparel companies over a two-year period in the past.
 Organizing and Visualizing Variables 2-45
-Referring to Scenario 2-17,construct a side-by-side bar chart.
Organizing and Visualizing Variables 2-45
-Referring to Scenario 2-17,construct a side-by-side bar chart.
(Essay)
4.9/5 (34)
SCENARIO 2-9
The frequency distribution below represents the rents of 250 randomly selected federally subsidized apartments in a small town.
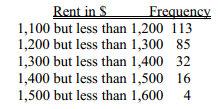 -Referring to Scenario 2-9,_____percent of the apartments rented for at least $1,300.
(Short Answer)
5.0/5 (24)
SCENARIO 2-9
The frequency distribution below represents the rents of 250 randomly selected federally subsidized apartments in a small town.
-Referring to Scenario 2-9,the class midpoint of the second class is_____ .
(Short Answer)
4.8/5 (33)
SCENARIO 2-14
The table below contains the number of people who own a portable Blu-ray player in a sample of 600 broken down by gender.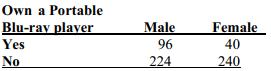 -Referring to Scenario 2-14,_____percent of the 600 were males who did not own a portable Blu-ray player.
(Short Answer)
5.0/5 (32)
Filters
- Essay(0)
- Multiple Choice(0)
- Short Answer(0)
- True False(0)
- Matching(0)