Exam 2: Organizing and Visualizing Variables
Exam 1: Defining and Collecting Data204 Questions
Exam 2: Organizing and Visualizing Variables185 Questions
Exam 3: Numerical Descriptive Measures167 Questions
Exam 4: Basic Probability163 Questions
Exam 5: Discrete Probability Distributions216 Questions
Exam 6: The Normal Distribution and Other Continuous Distributions187 Questions
Exam 7: Sampling Distributions129 Questions
Exam 8: Confidence Interval Estimation189 Questions
Exam 9: Fundamentals of Hypothesis Testing: One-Sample Tests185 Questions
Exam 10: Two-Sample Tests212 Questions
Exam 11: Analysis of Variance210 Questions
Exam 12: Chi-Square and Nonparametric Tests175 Questions
Exam 13: Simple Linear Regression210 Questions
Exam 14: Introduction to Multiple Regression256 Questions
Exam 15: Multiple Regression Model Building67 Questions
Exam 16: Time-Series Forecasting168 Questions
Exam 17: Business Analytics113 Questions
Exam 18: A Roadmap for Analyzing Data325 Questions
Exam 19: Statistical Applications in Quality Management158 Questions
Exam 20: Decision Making123 Questions
Exam 21: Getting Started: Important Things to Learn First35 Questions
Exam 22: Binomial Distribution and Normal Approximation230 Questions
Select questions type
SCENARIO 2-8
The Stem-and-Leaf display represents the number of times in a year that a random sample of 100 "lifetime" members of a health club actually visited the facility.
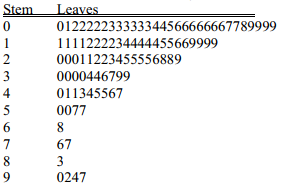 -Referring to Scenario 2-8,_____of the 100 members visited the health club no more than 12 times in a year.
(Short Answer)
4.8/5  (36)
(36)
SCENARIO 2-6
A sample of 200 students at a Big-Ten university was taken after the midterm to ask them whether they went bar hopping the weekend before the midterm or spent the weekend studying,and whether they did well or poorly on the midterm.The following table contains the result.
 -Referring to Scenario 2-6,_____percent of the students in the sample spent the weekend studying and did well on the midterm.
(Multiple Choice)
4.7/5 (34)
The Guidelines for Developing Visualizations recommend avoiding uncommon chart type such as doughnut,radar,cone and pyramid charts.
(True/False)
5.0/5 (30)
Apple Computer,Inc.collected information on the age of their customers.Suppose the youngest customer was 12 and the oldest was 72.To study the distribution of the age among its customers,it is best to use a pie chart.
(True/False)
4.8/5 (31)
A survey of 150 executives were asked what they think is the most common mistake candidates make during job interviews.Six different mistakes were given.Which of the following is the best for presenting the information?
(Multiple Choice)
5.0/5 (33)
SCENARIO 2-6
A sample of 200 students at a Big-Ten university was taken after the midterm to ask them whether they went bar hopping the weekend before the midterm or spent the weekend studying,and whether they did well or poorly on the midterm.The following table contains the result.
-Referring to Scenario 2-6,if the sample is a good representation of the population,we can expect_____ percent of those who spent the weekend studying to do poorly on the midterm.
(Multiple Choice)
4.9/5 (35)
Data on the number of part-time hours students at a public university worked in a week were collected.Which of the following is the best chart for presenting the information?
(Multiple Choice)
4.8/5 (32)
When constructing a frequency distribution,classes should be selected so that they are of equal width.
(True/False)
4.9/5 (28)
The width of each class grouping or interval in a frequency distribution should be_____ .
(Short Answer)
4.8/5 (35)
Determining the class boundaries of a frequency distribution is highly subjective.
(True/False)
4.9/5 (33)
SCENARIO 2-10
The histogram below represents scores achieved by 200 job applicants on a personality profile.
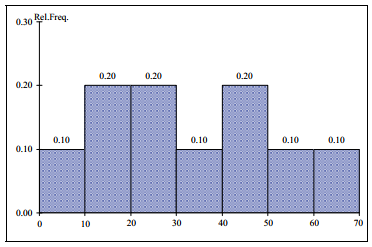 -Referring to the histogram from Scenario 2-10,_____percent of the job applicants scored between 10 and 20.
(Short Answer)
5.0/5 (36)
SCENARIO 2-10
The histogram below represents scores achieved by 200 job applicants on a personality profile.
-Referring to the histogram from Scenario 2-10,_____percent of the job applicants scored below 50.
(Short Answer)
4.8/5 (41)
SCENARIO 2-18
The stem-and-leaf display below shows the result of a survey on 50 students on their satisfaction with their school with the higher scores represent higher level of satisfaction.
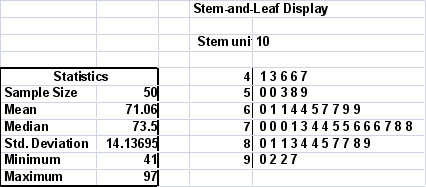 -Referring to Scenario 2-18,how many students have a satisfaction level below 60?
(Short Answer)
4.9/5 (39)
SCENARIO 2-18
The stem-and-leaf display below shows the result of a survey on 50 students on their satisfaction with their school with the higher scores represent higher level of satisfaction.
-Referring to Scenario 2-18,the level of satisfaction is concentrated around 75.
(True/False)
4.8/5 (30)
SCENARIO 2-14
The table below contains the number of people who own a portable Blu-ray player in a sample of 600 broken down by gender.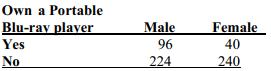 -Referring to Scenario 2-14,if the sample is a good representation of the population,we can expect _____percent of the males in the population will own a portable Blu-ray player.
(Short Answer)
4.8/5 (32)
SCENARIO 2-8
The Stem-and-Leaf display represents the number of times in a year that a random sample of 100 "lifetime" members of a health club actually visited the facility.
-Referring to Scenario 2-8,if a frequency distribution with equal sized classes was made from this data,and the first class was "0 but less than 10," the class midpoint of the third class would be_____.
(Short Answer)
4.8/5 (31)
SCENARIO 2-14
The table below contains the number of people who own a portable Blu-ray player in a sample of 600 broken down by gender.
-Referring to Scenario 2-13,construct a percentage polygon for the detergent data if the corresponding frequency distribution uses "9.0 but less than 10.0" as the first class.
(Essay)
4.8/5 (30)
The percentage distribution cannot be constructed from the frequency distribution directly.
(True/False)
4.9/5 (25)
SCENARIO 2-14
The table below contains the number of people who own a portable Blu-ray player in a sample of 600 broken down by gender.
-Referring to Scenario 2-14 of the females in the sample,_____percent owned a portable Blu-ray player.
(Short Answer)
4.8/5 (35)
The sum of cumulative frequencies in a distribution always equals 1.
(True/False)
4.9/5 (40)
Filters
- Essay(0)
- Multiple Choice(0)
- Short Answer(0)
- True False(0)
- Matching(0)