Exam 2: Organizing and Visualizing Variables
Exam 1: Defining and Collecting Data204 Questions
Exam 2: Organizing and Visualizing Variables185 Questions
Exam 3: Numerical Descriptive Measures167 Questions
Exam 4: Basic Probability163 Questions
Exam 5: Discrete Probability Distributions216 Questions
Exam 6: The Normal Distribution and Other Continuous Distributions187 Questions
Exam 7: Sampling Distributions129 Questions
Exam 8: Confidence Interval Estimation189 Questions
Exam 9: Fundamentals of Hypothesis Testing: One-Sample Tests185 Questions
Exam 10: Two-Sample Tests212 Questions
Exam 11: Analysis of Variance210 Questions
Exam 12: Chi-Square and Nonparametric Tests175 Questions
Exam 13: Simple Linear Regression210 Questions
Exam 14: Introduction to Multiple Regression256 Questions
Exam 15: Multiple Regression Model Building67 Questions
Exam 16: Time-Series Forecasting168 Questions
Exam 17: Business Analytics113 Questions
Exam 18: A Roadmap for Analyzing Data325 Questions
Exam 19: Statistical Applications in Quality Management158 Questions
Exam 20: Decision Making123 Questions
Exam 21: Getting Started: Important Things to Learn First35 Questions
Exam 22: Binomial Distribution and Normal Approximation230 Questions
Select questions type
SCENARIO 2-10
The histogram below represents scores achieved by 200 job applicants on a personality profile.
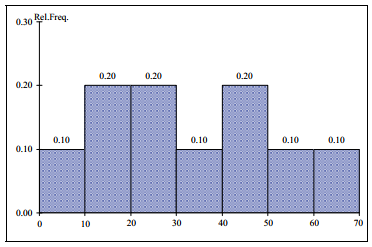 -Referring to the histogram from Scenario 2-10,the number of job applicants who scored 50 or above is_____ .
(Short Answer)
4.8/5  (36)
(36)
SCENARIO 2-14
The table below contains the number of people who own a portable Blu-ray player in a sample of 600 broken down by gender.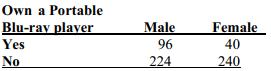 -Referring to Scenario 2-14,_____percent of the 600 were males who owned a portable Blu-ray player.
(Short Answer)
4.8/5 (28)
One of the developing countries is experiencing a baby boom,with the number of births rising for the fifth year in a row,according to a BBC News report.Which of the following is best for displaying this data?
(Multiple Choice)
4.8/5 (36)
When polygons or histograms are constructed,which axis must show the true zero or "origin"?
(Multiple Choice)
5.0/5 (32)
SCENARIO 2-10
The histogram below represents scores achieved by 200 job applicants on a personality profile.
-Referring to the histogram from Scenario 2-10,the number of job applicants who scored between 30 and below 60 is_____ .
(Short Answer)
4.8/5 (44)
SCENARIO 2-1
An insurance company evaluates many numerical variables about a person before deciding on an appropriate rate for automobile insurance.A representative from a local insurance agency selected a random sample of insured drivers and recorded,X,the number of claims each made in the last 3 years,with the following results.
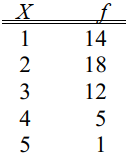 -Referring to Scenario 2-1,how many drivers are represented in the sample?
(Multiple Choice)
4.7/5 (30)
SCENARIO 2-3
Every spring semester,the School of Business coordinates a luncheon with local business leaders for graduating seniors,their families,and friends.Corporate sponsorship pays for the lunches of each of the seniors,but students must purchase tickets to cover the cost of lunches served to guests they bring with them.The following histogram represents the attendance at the senior luncheon,where X is the number of guests each graduating senior invited to the luncheon and f is the number of graduating seniors in each category.
1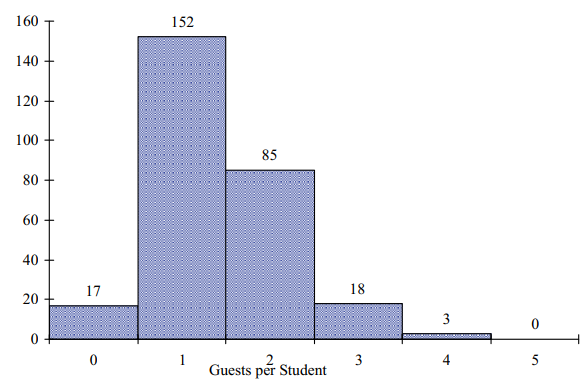 -Referring to the histogram from Scenario 2-3,if all the tickets purchased were used,how many guests attended the luncheon?
(Multiple Choice)
4.7/5 (31)
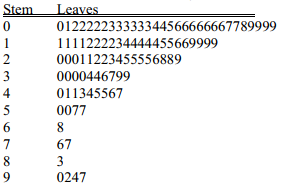
SCENARIO 2-7
The Stem-and-Leaf display below contains data on the number of months between the date a civil suit is filed and when the case is actually adjudicated for 50 cases heard in superior court.
 -Referring to Scenario 2-7,_____percent of the cases were adjudicated within the first 2 years.
(Short Answer)
4.8/5 (41)
The Guidelines for Developing Visualizations recommend using varying scale to conserve precious space whenever possible.
(True/False)
4.8/5 (34)
You have collected data on the monthly seasonally adjusted civilian unemployment rate for the United States over a 10-year period.Which of the following is the best for presenting the data?
(Multiple Choice)
4.9/5 (36)
You have collected information on the market share of 5 different search engines used by U.S.Internet users in a quarter.Which of the following is the best for presenting the information?
(Multiple Choice)
4.8/5 (35)
Percentage polygons are plotted at the boundaries of the class groupings.
(True/False)
4.9/5 (44)
SCENARIO 2-5
The following are the duration in minutes of a sample of long-distance phone calls made within the continental United States reported by one long-distance carrier.
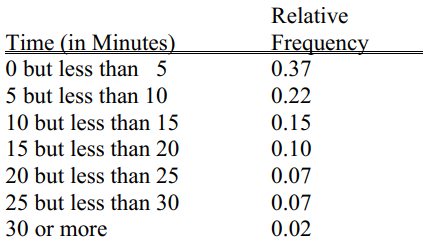 -Referring to Scenario 2-5,if 10 calls lasted 30 minutes or more,how many calls lasted less than 5 minutes?
(Multiple Choice)
4.9/5 (21)
SCENARIO 2-11
The ordered array below resulted from selecting a sample of 25 batches of 500 computer chips and determining how many in each batch were defective.
Defects
1 2 4 4 5 5 6 7 9 9 12 12 15
17 20 21 23 23 25 26 27 27 28 29 29
-Referring to Scenario 2-11,construct a cumulative percentage polygon for the defects data if the corresponding frequency distribution uses "0 but less than 5" as the first class.
(Essay)
4.8/5 (32)
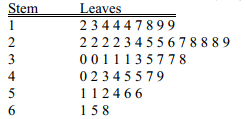
SCENARIO 2-8
The Stem-and-Leaf display represents the number of times in a year that a random sample of 100 "lifetime" members of a health club actually visited the facility.
 -Referring to Scenario 2-8,the person who visited the health club more than anyone else in the sample visited the facility_____ times.
(Short Answer)
4.8/5 (27)
SCENARIO 2-18
The stem-and-leaf display below shows the result of a survey on 50 students on their satisfaction with their school with the higher scores represent higher level of satisfaction.
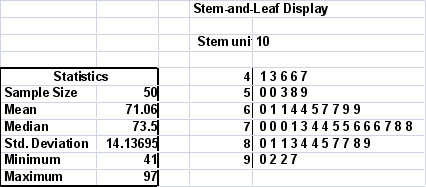 -Referring to Scenario 2-18,if a student is randomly selected,his/her most likely level of satisfaction will be in the 60s among the 40s,50s,60s,70s,80s and 90s.
(True/False)
4.8/5 (41)
The Guidelines for Developing Visualizations recommend using the simplest possible visualization.
(True/False)
4.8/5 (37)
A_____ is a summary table in which numerical data are tallied into class intervals or categories.
(Short Answer)
4.8/5 (24)
You have collected information on the consumption by the 15 largest coffee-consuming nations.Which of the following is the best for presenting the shares of the consumption?
(Multiple Choice)
4.8/5 (28)
SCENARIO 2-1
An insurance company evaluates many numerical variables about a person before deciding on an appropriate rate for automobile insurance.A representative from a local insurance agency selected a random sample of insured drivers and recorded,X,the number of claims each made in the last 3 years,with the following results.
-A type of vertical bar chart in which the categories are plotted in the descending rank order of the magnitude of their frequencies is called a
(Multiple Choice)
5.0/5 (32)
Filters
- Essay(0)
- Multiple Choice(0)
- Short Answer(0)
- True False(0)
- Matching(0)