Exam 2: Organizing and Visualizing Variables
Exam 1: Defining and Collecting Data204 Questions
Exam 2: Organizing and Visualizing Variables185 Questions
Exam 3: Numerical Descriptive Measures167 Questions
Exam 4: Basic Probability163 Questions
Exam 5: Discrete Probability Distributions216 Questions
Exam 6: The Normal Distribution and Other Continuous Distributions187 Questions
Exam 7: Sampling Distributions129 Questions
Exam 8: Confidence Interval Estimation189 Questions
Exam 9: Fundamentals of Hypothesis Testing: One-Sample Tests185 Questions
Exam 10: Two-Sample Tests212 Questions
Exam 11: Analysis of Variance210 Questions
Exam 12: Chi-Square and Nonparametric Tests175 Questions
Exam 13: Simple Linear Regression210 Questions
Exam 14: Introduction to Multiple Regression256 Questions
Exam 15: Multiple Regression Model Building67 Questions
Exam 16: Time-Series Forecasting168 Questions
Exam 17: Business Analytics113 Questions
Exam 18: A Roadmap for Analyzing Data325 Questions
Exam 19: Statistical Applications in Quality Management158 Questions
Exam 20: Decision Making123 Questions
Exam 21: Getting Started: Important Things to Learn First35 Questions
Exam 22: Binomial Distribution and Normal Approximation230 Questions
Select questions type
The relative frequency is the frequency in each class divided by the total number of observations.
(True/False)
4.9/5  (39)
(39)
A good choice for the number of class groups to use in constructing frequency distribution is to have at least 5 but no more than 15 class groups.
(True/False)
4.9/5 (35)
The stem-and-leaf display is often superior to the frequency distribution in that it maintains the original values for further analysis.
(True/False)
4.8/5 (27)
SCENARIO 2-17
The following table presents total retail sales in millions of dollars for the leading apparel companies over a two-year period in the past.
 Organizing and Visualizing Variables 2-45
-Referring to Scenario 2-17,construct a table of column percentages.
Organizing and Visualizing Variables 2-45
-Referring to Scenario 2-17,construct a table of column percentages.
(Essay)
4.8/5 (33)
SCENARIO 2-14
The table below contains the number of people who own a portable Blu-ray player in a sample of 600 broken down by gender.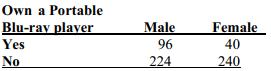 -Referring to Scenario 2-14,if the sample is a good representation of the population,we can expect_____ percent of the population will be males.
(Short Answer)
4.9/5 (31)
SCENARIO 2-14
The table below contains the number of people who own a portable Blu-ray player in a sample of 600 broken down by gender.
-Referring to Scenario 2-13,if a percentage histogram for the detergent data is constructed,using "9.0 but less than 10.0 gallons" as the first class,the percentage of drive-through car wash operations that use "12.0 but less than 13.0 gallons" of detergent would be_____ .
(Short Answer)
4.7/5 (37)
The point halfway between the boundaries of each class interval in a grouped frequency distribution is called the_____ .
(Short Answer)
4.9/5 (35)
SCENARIO 2-7
The Stem-and-Leaf display below contains data on the number of months between the date a civil suit is filed and when the case is actually adjudicated for 50 cases heard in superior court.
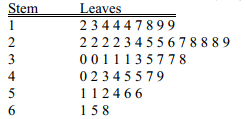 -Referring to Scenario 2-7,if a frequency distribution with equal sized classes was made from this data,and the first class was "10 but less than 20," the cumulative percentage of the second class would be_____ .
(Short Answer)
4.9/5 (36)
A multidimensional contingency table allows you to tally the responses of more than two categorical variables.
(True/False)
4.9/5 (39)
SCENARIO 2-14
The table below contains the number of people who own a portable Blu-ray player in a sample of 600 broken down by gender.
-Referring to Scenario 2-14,construct a table of row percentages.
(Essay)
4.9/5 (28)
The Guidelines for Developing Visualizations recommend always including a scale for each axis if the chart contains axes.
(True/False)
4.8/5 (29)
You have collected data on the number of complaints for 6 different brands of automobiles sold in the US over a 10-year period.Which of the following is the best for presenting the data?
(Multiple Choice)
4.8/5 (30)
SCENARIO 2-2
2-2 Organizing and Visualizing Variables
At a meeting of information systems officers for regional offices of a national company,a survey was taken to determine the number of employees the officers supervise in the operation of their departments,where X is the number of employees overseen by each information systems officer.
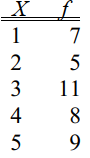 -Referring to Scenario 2-2,how many regional offices are represented in the survey results?
(Multiple Choice)
4.8/5 (36)
SCENARIO 2-7
The Stem-and-Leaf display below contains data on the number of months between the date a civil suit is filed and when the case is actually adjudicated for 50 cases heard in superior court.
-Referring to Scenario 2-7,_____percent of the cases were not adjudicated within the first 4 years.
(Short Answer)
4.9/5 (29)
SCENARIO 2-14
The table below contains the number of people who own a portable Blu-ray player in a sample of 600 broken down by gender.
-Referring to Scenario 2-14,of the females in the sample,_____percent did not own a portable Blu-ray player.
(Short Answer)
4.9/5 (31)
A research analyst was directed to arrange raw data collected on the yield of wheat,ranging from 40 to 93 bushels per acre,in a frequency distribution.He should choose 30 as the class interval width.
(True/False)
4.8/5 (31)
The main principle behind the Pareto chart is the ability to separate the "vital few" from the "trivial many."
(True/False)
5.0/5 (34)
Given below is the scatter plot of the number of employees and the total revenue ($millions)of 20 U.S.companies.There appears to be a positive relationship between total revenue and the number of employees.
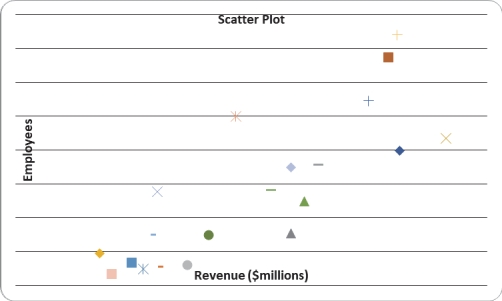
(True/False)
4.8/5 (33)
The original data values cannot be determined once they are grouped into a frequency distribution table.
(True/False)
4.7/5 (31)
Filters
- Essay(0)
- Multiple Choice(0)
- Short Answer(0)
- True False(0)
- Matching(0)