Exam 3: Descriptive Statistics: Numerical Measures
Exam 1: Data and Statistics84 Questions
Exam 2: Descriptive Statistics: Tabular and Graphical Displays67 Questions
Exam 3: Descriptive Statistics: Numerical Measures127 Questions
Exam 4: Introduction to Probability99 Questions
Exam 5: Discrete Probability Distributions86 Questions
Exam 6: Continuous Probability Distributions120 Questions
Exam 7: Sampling and Sampling Distributions117 Questions
Exam 8: Interval Estimation144 Questions
Exam 9: Hypothesis Tests129 Questions
Exam 10: Inference About Means and Proportions With Two Populations85 Questions
Exam 11: Inferences About Population Variances85 Questions
Exam 12: Comparing Multiple Proportions, Tests of Independence and Goodness of Fit59 Questions
Exam 13: Experimental Design and Analysis of Variance80 Questions
Exam 14: Simple Linear Regression131 Questions
Exam 15: Multiple Regression103 Questions
Select questions type
Which of the following symbols represents the variance of the population?
Free
(Multiple Choice)
4.7/5  (37)
(37)
Correct Answer: Verified
A
Since the mode is the most frequently occurring data value, it
Free
(Multiple Choice)
4.9/5 (42)
Correct Answer:Verified
D
The following frequency distribution shows the GMAT scores of a sample of MBA students: 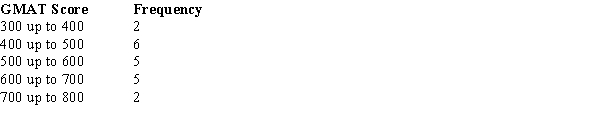
For the above data, compute the mean GMAT score.
For the above data, compute the mean GMAT score.
Free
(Short Answer)
4.8/5 (38)
Correct Answer:Verified
545
Last semester grades of Michael, a freshman at a local college are shown below.
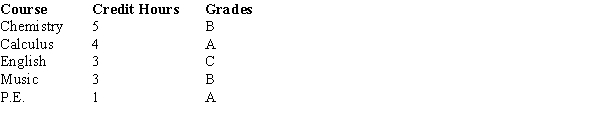
The local university uses a 4 point grading system, i.e., A = 4, B = 3, C = 2, D = 1, F = 0.Compute Michael's semester grade point average.
The local university uses a 4 point grading system, i.e., A = 4, B = 3, C = 2, D = 1, F = 0.Compute Michael's semester grade point average.
(Short Answer)
4.8/5 (39)
In 2012, the average donation to the Community Kitchen was $900 with a standard deviation of $180.In 2013, the average donation was $1,600 with a standard deviation of $240.In which year do the donations show a more dispersed distribution?
(Essay)
4.8/5 (31)
The following is the frequency distribution for the speed of a sample of automobiles traveling on an interstate highway. 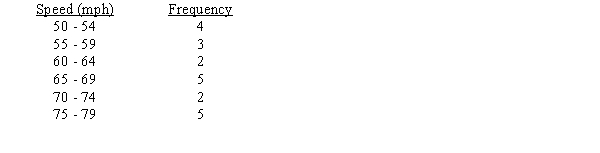 The mean is
(Multiple Choice)
4.9/5 (40)
A box plot is a graphical representation of data that is based on
(Multiple Choice)
4.8/5 (39)
The descriptive measure of variability that is based on the concept of a variation about the mean is the
(Multiple Choice)
4.8/5 (34)
When should measures of location and dispersion be computed from grouped data rather than from individual data values?
(Multiple Choice)
4.8/5 (30)
Which of the following symbols represents the standard deviation of the population?
(Multiple Choice)
4.8/5 (36)
The relative frequency of a class is computed by dividing the
(Multiple Choice)
4.9/5 (33)
Which of the following symbols represents the mean of the population?
(Multiple Choice)
4.8/5 (42)
Which of the following symbols represents the size of the population?
(Multiple Choice)
4.7/5 (39)
Which of the following is not a measure of variability of a single variable?
(Multiple Choice)
4.9/5 (39)
The standard deviation of a sample of 81 observations equals 49.The variance of the sample equals
(Multiple Choice)
4.8/5 (41)
Filters
- Essay(0)
- Multiple Choice(0)
- Short Answer(0)
- True False(0)
- Matching(0)