Exam 12: Comparing Multiple Proportions, Tests of Independence and Goodness of Fit
Exam 1: Data and Statistics84 Questions
Exam 2: Descriptive Statistics: Tabular and Graphical Displays67 Questions
Exam 3: Descriptive Statistics: Numerical Measures127 Questions
Exam 4: Introduction to Probability99 Questions
Exam 5: Discrete Probability Distributions86 Questions
Exam 6: Continuous Probability Distributions120 Questions
Exam 7: Sampling and Sampling Distributions117 Questions
Exam 8: Interval Estimation144 Questions
Exam 9: Hypothesis Tests129 Questions
Exam 10: Inference About Means and Proportions With Two Populations85 Questions
Exam 11: Inferences About Population Variances85 Questions
Exam 12: Comparing Multiple Proportions, Tests of Independence and Goodness of Fit59 Questions
Exam 13: Experimental Design and Analysis of Variance80 Questions
Exam 14: Simple Linear Regression131 Questions
Exam 15: Multiple Regression103 Questions
Select questions type
The owner of a car wash wants to see if the arrival rate of cars follows a Poisson distribution.In order to test the assumption of a Poisson distribution, a random sample of 150 ten-minute intervals was taken.You are given the following observed frequencies: 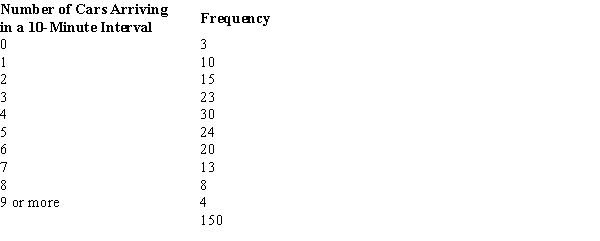 At the .05 level of significance, the conclusion of the test is that the
(Multiple Choice)
4.8/5  (34)
(34)
The following data show the scores of a sample of 40 students who have taken statistics. 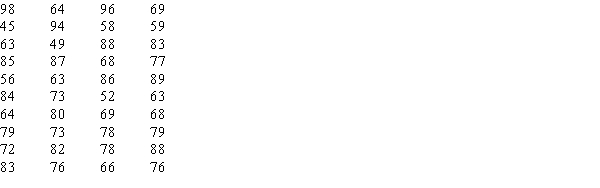
Use α = .10 and conduct a goodness of fit test to determine if the sample comes from a population that has a normal distribution.Use the critical value approach.
Use α = .10 and conduct a goodness of fit test to determine if the sample comes from a population that has a normal distribution.Use the critical value approach.
(Essay)
4.8/5 (37)
When individuals in a sample of 150 were asked whether or not they supported capital punishment, the following information was obtained.  We are interested in determining whether or not the opinions of the individuals (as to Yes, No, and No Opinion) are uniformly distributed.The number of degrees of freedom associated with this problem is
(Multiple Choice)
5.0/5 (27)
You want to test whether or not the following sample of 30 observations follows a normal distribution.The mean of the sample equals 11.83 and the standard deviation equals 4.53. 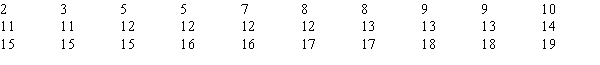 The number of intervals or categories used to test the hypothesis for this problem is
(Multiple Choice)
4.9/5 (31)
Two hundred fifty managers with degrees in business administration indicated their fields of concentration as shown below. 
At α = .01 using the p-value approach, test to determine if the position in management is independent of the major of concentration.
At α = .01 using the p-value approach, test to determine if the position in management is independent of the major of concentration.
(Essay)
4.9/5 (35)
The owner of a car wash wants to see if the arrival rate of cars follows a Poisson distribution.In order to test the assumption of a Poisson distribution, a random sample of 150 ten-minute intervals was taken.You are given the following observed frequencies:  Calculate mean and use Poisson probabilities.The expected frequency of exactly 3 cars arriving in a 10-minute interval is
(Multiple Choice)
4.9/5 (36)
Last school year, the student body of a local university consisted of 30% freshmen, 24% sophomores, 26% juniors, and 20% seniors.A sample of 400 students taken from this year's student body showed the following number of students in each classification.  We are interested in determining whether or not there has been a significant change in the classifications between the last school year and this school year.The expected frequency of seniors is
(Multiple Choice)
4.9/5 (39)
When individuals in a sample of 150 were asked whether or not they supported capital punishment, the following information was obtained.  We are interested in determining whether or not the opinions of the individuals (as to Yes, No, and No Opinion) are uniformly distributed.The conclusion of the test at the 5% level of significance is that the
(Multiple Choice)
4.9/5 (30)
The owner of a car wash wants to see if the arrival rate of cars follows a Poisson distribution.In order to test the assumption of a Poisson distribution, a random sample of 150 ten-minute intervals was taken.You are given the following observed frequencies:  The calculated value for the test statistic equals
(Multiple Choice)
4.8/5 (33)
The sampling distribution for a goodness of fit test is the _____ distribution.
(Multiple Choice)
4.8/5 (36)
In the past, 35% of the students at ABC University were in the Business College, 35% of the students were in the Liberal Arts College, and 30% of the students were in the Education College.To see whether or not the proportions have changed, a sample of 300 students from the university was taken.Ninety of the sample students are in the Business College, 120 are in the Liberal Arts College, and 90 are in the Education College.This problem is an example of a
(Multiple Choice)
4.8/5 (26)
The table below gives beverage preferences for random samples of teens and adults. 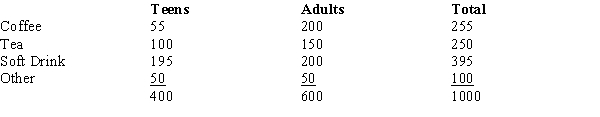 We are asked to test for independence between age (i.e., adult and teen) and drink preferences.The test statistic for this test of independence is
(Multiple Choice)
4.8/5 (37)
In 2002, 40% of the students at a major university were Business majors, 35% were Engineering majors, and the rest of the students were majoring in other fields.In a sample of 600 students from the same university taken in 2003, 200 were Business majors, 220 were Engineering majors, and the remaining students in the sample were majoring in other fields.Using α = .01, test to see if there has been a significant change in the proportions between 2002 and 2003.
(Essay)
4.8/5 (29)
A group of 2000 individuals from 3 different cities were asked whether they owned a foreign or a domestic car.The following table shows the results of the survey. 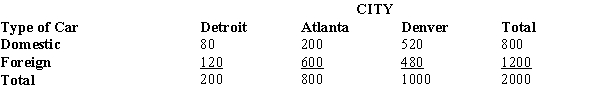
At α = .01 using the p-value approach, test to determine if the type of car purchased is independent of the city in which the purchasers live.
At α = .01 using the p-value approach, test to determine if the type of car purchased is independent of the city in which the purchasers live.
(Essay)
4.7/5 (39)
The test for goodness of fit, test of independence, and test of multiple proportions are designed for use with _____ data.
(Multiple Choice)
4.9/5 (39)
In the past, 35% of the students at ABC University were in the Business College, 35% of the students were in the Liberal Arts College, and 30% of the students were in the Education College.To see whether or not the proportions have changed, a sample of 300 students from the university was taken.Ninety of the sample students are in the Business College, 120 are in the Liberal Arts College, and 90 are in the Education College.The calculated value for the test statistic equals
(Multiple Choice)
4.8/5 (31)
The degrees of freedom for a table with 7 rows and 4 columns is
(Multiple Choice)
4.7/5 (36)
The test statistic for goodness of fit has a chi-square distribution with k - 1 degrees of freedom provided that the expected frequencies for all categories are
(Multiple Choice)
4.7/5 (33)
The table below gives beverage preferences for random samples of teens and adults. 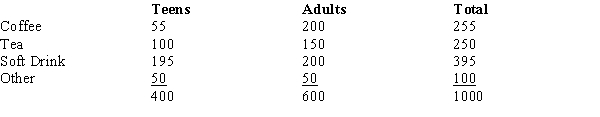 We are asked to test for independence between age (i.e., adult and teen) and drink preferences.The expected number of adults who prefer coffee is
(Multiple Choice)
4.9/5 (30)
Filters
- Essay(0)
- Multiple Choice(0)
- Short Answer(0)
- True False(0)
- Matching(0)