Exam 2: Descriptive Statistics: Tabular and Graphical Displays
Exam 1: Data and Statistics84 Questions
Exam 2: Descriptive Statistics: Tabular and Graphical Displays67 Questions
Exam 3: Descriptive Statistics: Numerical Measures127 Questions
Exam 4: Introduction to Probability99 Questions
Exam 5: Discrete Probability Distributions86 Questions
Exam 6: Continuous Probability Distributions120 Questions
Exam 7: Sampling and Sampling Distributions117 Questions
Exam 8: Interval Estimation144 Questions
Exam 9: Hypothesis Tests129 Questions
Exam 10: Inference About Means and Proportions With Two Populations85 Questions
Exam 11: Inferences About Population Variances85 Questions
Exam 12: Comparing Multiple Proportions, Tests of Independence and Goodness of Fit59 Questions
Exam 13: Experimental Design and Analysis of Variance80 Questions
Exam 14: Simple Linear Regression131 Questions
Exam 15: Multiple Regression103 Questions
Select questions type
A graphical device for depicting categorical data that have been summarized in a frequency distribution, relative frequency distribution, or percent frequency distribution is a
Free
(Multiple Choice)
4.8/5  (37)
(37)
Correct Answer: Verified
D
Which of the following is not a recommended guideline for creating an effective graphical display?
Free
(Multiple Choice)
4.8/5 (25)
Correct Answer:Verified
B
The sales records of a real estate company for the month of May shows the following house prices (rounded to the nearest $1,000).Values are in thousands of dollars. 
a.
Develop a frequency distribution and a percent frequency distribution for the house prices.(Use 5 classes and have your first class be 20 - 39.)
b.
Develop a cumulative frequency and a cumulative percent frequency distribution for the above data.
c.
What percentage of the houses are sold at a price below $80,000?
Free
(Essay)
4.8/5 (29)
Correct Answer:Verified
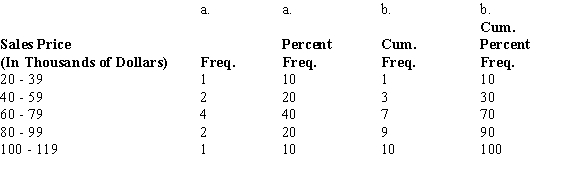 c.70%
c.70%
Data that provide labels or names for categories of like items are known as _____ data.
(Multiple Choice)
4.9/5 (33)
The test scores of 14 individuals on their first statistics examination are shown below. 
Construct a stem-and-leaf display for these data.
Construct a stem-and-leaf display for these data.
(Essay)
4.8/5 (27)
You are given the following data on the age of employees at a company.Construct a stem-and-leaf display. 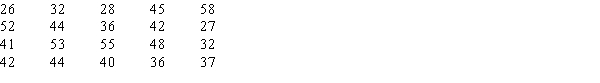
(Essay)
4.8/5 (34)
In quality control applications, bar charts are used to identify the most important causes of problems.When the bars are arranged in descending order of height from left to right with the most frequently occurring cause appearing first, the bar chart is called a
(Multiple Choice)
4.9/5 (41)
A sample of fifteen 7-year old boys shows their favorite superheroes: 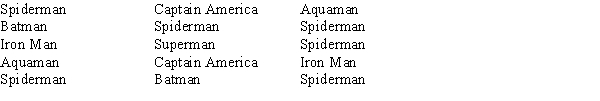 Which of the following is the correct percent frequency for Spiderman?
(Multiple Choice)
4.8/5 (27)
In a cumulative percent frequency distribution, the last class will have a cumulative percent frequency equal to
(Multiple Choice)
4.9/5 (42)
A sample of 15 children shows their favorite kind of pet: 
Which of the following distributions would be inappropriate for this data?
Which of the following distributions would be inappropriate for this data?
(Multiple Choice)
4.7/5 (39)
Thirty students in the School of Business were asked what their majors were.The following represents their responses (M = Management; A = Accounting; E = Economics; O = Others). 
a.
Construct a frequency distribution and a bar chart.
b.
Construct a relative frequency distribution and a pie chart.
a.
Construct a frequency distribution and a bar chart.
b.
Construct a relative frequency distribution and a pie chart.
(Essay)
4.8/5 (30)
Which of the following is least useful in making comparisons or showing the relationships of two variables?
(Multiple Choice)
4.8/5 (35)
A display used to compare the frequency, relative frequency or percent frequency of two categorical variables is a
(Multiple Choice)
4.8/5 (25)
The numbers of hours worked on homework (per week) by 400 statistics students are shown below. 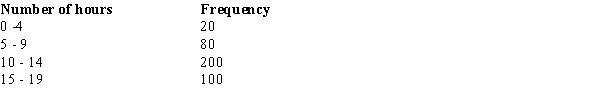 The class width used in this frequency distribution is
(Multiple Choice)
4.9/5 (33)
Histograms based on data on housing prices and salaries typically are
(Multiple Choice)
5.0/5 (36)
Which of the following graphical methods shows the relationship between two variables?
(Multiple Choice)
4.8/5 (43)
A survey of 800 college seniors resulted in the following crosstabulation regarding their undergraduate major and whether or not they plan to go to graduate school. 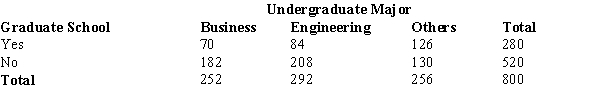 The above crosstabulation shows
(Multiple Choice)
4.8/5 (27)
Filters
- Essay(0)
- Multiple Choice(0)
- Short Answer(0)
- True False(0)
- Matching(0)