Exam 10: Inference About Means and Proportions With Two Populations
Exam 1: Data and Statistics84 Questions
Exam 2: Descriptive Statistics: Tabular and Graphical Displays67 Questions
Exam 3: Descriptive Statistics: Numerical Measures127 Questions
Exam 4: Introduction to Probability99 Questions
Exam 5: Discrete Probability Distributions86 Questions
Exam 6: Continuous Probability Distributions120 Questions
Exam 7: Sampling and Sampling Distributions117 Questions
Exam 8: Interval Estimation144 Questions
Exam 9: Hypothesis Tests129 Questions
Exam 10: Inference About Means and Proportions With Two Populations85 Questions
Exam 11: Inferences About Population Variances85 Questions
Exam 12: Comparing Multiple Proportions, Tests of Independence and Goodness of Fit59 Questions
Exam 13: Experimental Design and Analysis of Variance80 Questions
Exam 14: Simple Linear Regression131 Questions
Exam 15: Multiple Regression103 Questions
Select questions type
Two independent simple random samples are taken to test the difference between the means of two populations whose standard deviations are not known, but are assumed to be equal.The sample sizes are n1 = 25 and n2 = 30.The correct distribution to use is the t distribution with _____ degrees of freedom.
Free
(Multiple Choice)
4.8/5  (34)
(34)
Correct Answer: Verified
B
If we are interested in testing whether the proportion of items in population 1 is larger than the proportion of items in population 2, the
Free
(Multiple Choice)
4.9/5 (37)
Correct Answer:Verified
D
A potential investor conducted a 144-day survey in each of the North Mall and South Mall theaters in order to determine the difference between the average daily attendance at these two theaters.The North Mall theater averaged 630 patrons per day; while the South Mall theater averaged 598 patrons per day.From past information, it is known that the variance for North Mall is 1000; while the variance for the South Mall is 1304.Develop a 98% confidence interval for the difference between the average daily attendance at the two theaters.
Free
(Short Answer)
5.0/5 (38)
Correct Answer:Verified
22.68 to 41.32 (rounding: 23 to 41)
An insurance company selected samples of clients under 18 years of age and over 18 and recorded the number of accidents they had in the previous year.The results are shown below.  We are interested in determining if the accident proportions differ between the two age groups.Let pu represent the proportion under and po the proportion over the age of 18.The null hypothesis is
(Multiple Choice)
4.9/5 (39)
Salary information regarding male and female employees of a large company is shown below.  At 95% confidence, the margin of error is
(Multiple Choice)
4.9/5 (32)
The sampling distribution of  -
-  is approximated by a normal distribution if _____ are all greater than or equal to 5.
(Multiple Choice)
4.8/5 (38)
The following information was obtained from independent random samples taken of two populations. Assume normally distributed populations with equal variances. 
The degrees of freedom for the t distribution are
The degrees of freedom for the t distribution are
(Multiple Choice)
4.7/5 (32)
Generally, the ________ sample procedure for inferences about two population means provides better precision than the _______ sample approach.
(Multiple Choice)
4.7/5 (37)
Salary information regarding male and female employees of a large company is shown below.  If you are interested in testing whether or not the population average salary of males is significantly greater than that of females, at α = .05, the conclusion is that the population
(Multiple Choice)
4.9/5 (42)
In order to determine whether or not there is a significant difference between the mean hourly wages paid by two companies (of the same industry), the following data have been accumulated. 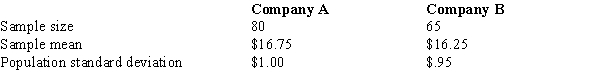 At the 5% level of significance, the null hypothesis
(Multiple Choice)
4.7/5 (26)
Salary information regarding male and female employees of a large company is shown below. 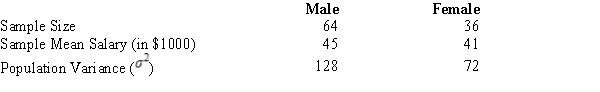 If you are interested in testing whether or not the population average salary of males is significantly greater than that of females at an α = .05, the test statistic is
(Multiple Choice)
4.7/5 (41)
From production line A, a sample of 500 items is selected at random, and it is determined that 30 items are defective.In a sample of 300 items from production process B (which produces identical items to line A), there are 12 defective items.Determine a 95% confidence interval estimate for the difference between the proportion of defectives in the two lines.
(Short Answer)
4.8/5 (30)
A statistics teacher wants to see if there is any difference in the abilities of students enrolled in statistics today and those enrolled five years ago.A sample of final examination scores from students enrolled today and from students enrolled five years ago was taken.You are given the following information.  The standard error of
  -
-  is
is
(Multiple Choice)
4.8/5 (33)
The management of a department store is interested in estimating the difference between the mean credit purchases of customers using the store's credit card versus those customers using a national major credit card.You are given the following information. 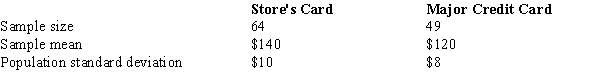 A 95% confidence interval estimate for the difference between the average purchases of all customers using the two different credit cards is
(Multiple Choice)
4.8/5 (23)
The following information was obtained from matched samples regarding the productivity (in units per hour) of four individuals using two different methods of production. 
Let d = Method 1 - Method 2.Is there a significant difference between the mean productivity of the two methods? Let α = .05.Assume the population of differences is normally distributed.
Let d = Method 1 - Method 2.Is there a significant difference between the mean productivity of the two methods? Let α = .05.Assume the population of differences is normally distributed.
(Essay)
4.9/5 (39)
The following information was obtained from matched samples taken from two populations.Assume the population of differences is normally distributed.  If the null hypothesis H0: μd = 0 is tested at the 5% level,
(Multiple Choice)
4.8/5 (32)
The following information is given concerning the ACT scores of high school seniors from two local schools. 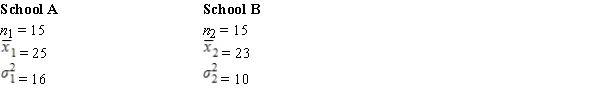
Develop a 98% confidence interval estimate for the difference between the two population means.Assume the two populations are normally distributed.
Develop a 98% confidence interval estimate for the difference between the two population means.Assume the two populations are normally distributed.
(Short Answer)
4.9/5 (35)
A statistics teacher wants to see if there is any difference in the abilities of students enrolled in statistics today and those enrolled five years ago.A sample of final examination scores from students enrolled today and from students enrolled five years ago was taken.You are given the following information. 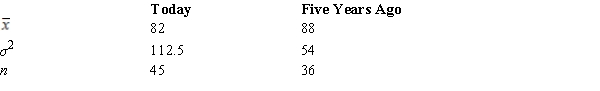 The point estimate for the difference between the means of the two populations is
(Multiple Choice)
4.8/5 (31)
Samples of employees of Companies A and B provided the following information regarding the ages of employees. 
Develop a 97% confidence interval for the difference between the average ages of the employees of the two companies.
Develop a 97% confidence interval for the difference between the average ages of the employees of the two companies.
(Short Answer)
4.9/5 (37)
Filters
- Essay(0)
- Multiple Choice(0)
- Short Answer(0)
- True False(0)
- Matching(0)