Exam 23: Cost Estimation and Cost Behaviour
Silversleeves, SA., shipped 18,000 tons of silver for £450,000 in January and 22,000 tons for £549,000 in February. Shipping costs for 21,000 tons to be shipped in March would be expected to be
C
The appropriate range for the coefficient of correlation (r) is
C
Identify the three different cost estimation techniques and provide a description of the strengths and weaknesses of each.
Scatter Diagrams: Scatter diagrams help identify representative high and low volumes. They are also useful in determining if costs can be reasonably approximated by a straight line. Scatter diagrams are simple to use, but professional judgment is required to draw a representative straight line through the plot of historical data. This method is subjective in nature, and probability intervals cannot be developed.
High-Low Cost Estimation: This method uses data from two time periods to estimate fixed and variable costs. This is a good method to use when data are limited. It is a subjective method, and probability intervals cannot be developed. It is very important that the high and low volumes represent the normal operating conditions of all observations. Again, professional judgment is required to select the appropriate data.
Least-Squares Method: This method uses all available data. It uses a mathematical criterion, which provides for an objective approach to cost estimation. In addition, this method can provide information on how well the cost estimating equation fits the historical cost data and information needed to construct probability intervals for cost estimates. It can also be used to develop equations that are not linear in nature. This method requires more data points than do the high-low or scatter diagram methods.
A managerial accountant has determined the following relationships between overhead and several possible bases: 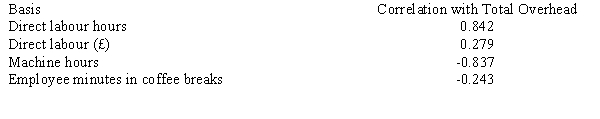 The best basis for overhead application is
What is the difference between a correlation equal to -1 and a correlation equal to +1?
Figure 23-1
Lee Ltd. manufactures and sells party items. The following representative direct labour hours and production costs are provided for a four-month period: 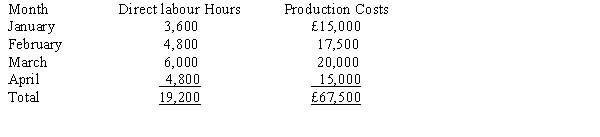 Let
a
=
Fixed production costs per month
b
=
Variable production costs per direct labour hour
n
=
Number of months
X
=
Direct labour hours per month
Y
=
Total monthly production costs
=
Summation
-Refer to Figure 23-1. Monthly production costs can be expressed as follows:
Let
a
=
Fixed production costs per month
b
=
Variable production costs per direct labour hour
n
=
Number of months
X
=
Direct labour hours per month
Y
=
Total monthly production costs
=
Summation
-Refer to Figure 23-1. Monthly production costs can be expressed as follows:
Rush Company is trying to find an appropriate allocation base for factory overhead. Presented are five months of data: 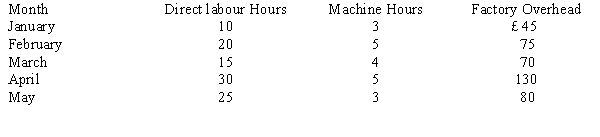 r =
r = 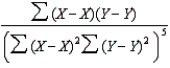 Required:
a.
Calculate the correlation coefficient between factory overhead and direct labour hours.
b.
Calculate the correlation coefficient between factory overhead and machine hours.
c.
Should Rush Company use direct labour hours or machine hours for their allocation base for factory overhead? Why?
Required:
a.
Calculate the correlation coefficient between factory overhead and direct labour hours.
b.
Calculate the correlation coefficient between factory overhead and machine hours.
c.
Should Rush Company use direct labour hours or machine hours for their allocation base for factory overhead? Why?
The following information is available for electricity costs for the last six months of the year:  Using the high-low method, estimated variable cost per unit of production is
The following information was taken from a computer printout generated with the least-squares method for use in estimating overhead costs: 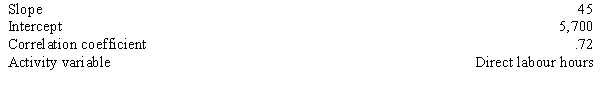 The cost formula is
Assume the following information: 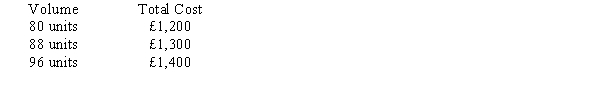 What is the variable cost per unit?
When the method of least squares is used to fit an equation involving two or more explanatory or independent variables, the method is called
If the independent variable is production volume and the dependent variable is total manufacturing cost, a coefficient of determination of .90 indicates
Given the cost function, Y = £10,000 + £4X, at what level of the activity cost drivers will total cost be £22,000?
The following computer printout estimated overhead costs using regression: 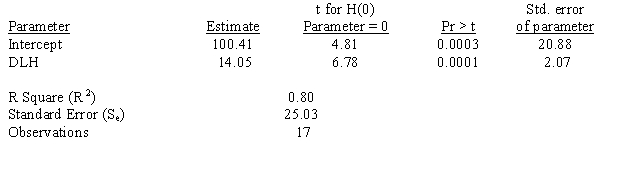 What is the 95 percent confidence interval around the slope estimate?
If the coefficient of correlation between machine hours and utilities cost is equal to 0.98 (r = 0.98), the correlation is
Filters
- Essay(0)
- Multiple Choice(0)
- Short Answer(0)
- True False(0)
- Matching(0)