Exam 9: Application: International Trade
Exam 1: Ten Principles of Economics455 Questions
Exam 2: Thinking Like an Economist643 Questions
Exam 3: Interdependence and the Gains From Trade547 Questions
Exam 4: The Market Forces of Supply and Demand693 Questions
Exam 5: Elasticity and Its Application626 Questions
Exam 6: Supply, Demand, and Government Policies668 Questions
Exam 7: Consumers, Producers, and the Efficiency of Markets547 Questions
Exam 8: Applications: the Costs of Taxation509 Questions
Exam 9: Application: International Trade521 Questions
Exam 10: Externalities543 Questions
Exam 11: Public Goods and Common Resources452 Questions
Exam 12: The Design of the Tax System664 Questions
Exam 13: The Costs of Production649 Questions
Exam 14: Firms in Competitive Markets604 Questions
Exam 15: Monopoly662 Questions
Exam 16: Monopolistic Competition649 Questions
Exam 17: Oligopoly522 Questions
Exam 18: The Markets for the Factors of Production592 Questions
Exam 19: Earnings and Discrimination511 Questions
Exam 20: Income Inequality and Poverty478 Questions
Exam 21: The Theory of Consumer Choice570 Questions
Exam 22: Frontiers in Microeconomics461 Questions
Exam 23: Measuring a Nation S Income547 Questions
Exam 24: Measuring the Cost of Living565 Questions
Exam 25: Production and Growth527 Questions
Exam 26: Saving, Investment, and the Financial System637 Questions
Exam 27: Tools of Finance534 Questions
Exam 28: Unemployment and Its Natural Rate701 Questions
Exam 29: The Monetary System540 Questions
Exam 30: Money Growth and Inflation504 Questions
Exam 31: Open-Economy Macroeconomics: Basic Concepts540 Questions
Exam 32: A Macroeconomic Theory of the Open Economy511 Questions
Exam 33: Aggregate Demand and Aggregate Supply572 Questions
Exam 34: The Influence of Monetary and Fiscal Policy on Aggregate Demand523 Questions
Exam 35: The Short-Run Tradeoff Between Inflation and Unemployment536 Questions
Exam 36: Six Debates Over Macroeconomic Policy354 Questions
Select questions type
Figure 9-9 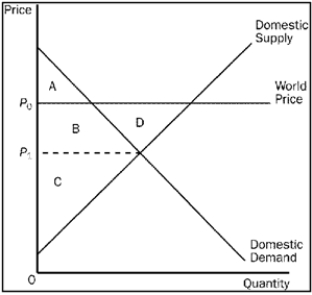 -Refer to Figure 9-9. The change in total surplus in this market because of trade is
(Multiple Choice)
4.9/5  (35)
(35)
Import quotas and tariffs make domestic sellers better off and domestic buyers worse off.
(True/False)
4.8/5 (34)
Figure 9-17 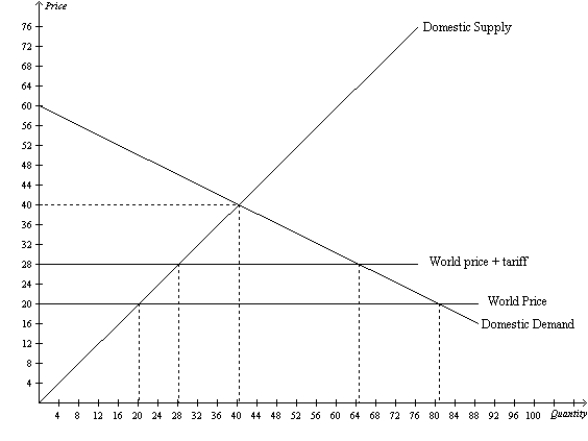 -Refer to Figure 9-17. The deadweight loss caused by the tariff is
(Multiple Choice)
4.9/5 (36)
According to the principle of comparative advantage, all countries can benefit from trading with one another because trade allows each country to specialize in doing what it does best.
(True/False)
4.9/5 (35)
After a country goes from disallowing trade in coffee with other countries to allowing trade in coffee with other countries,
(Multiple Choice)
4.8/5 (28)
For Country A, the world price of textiles exceeds the domestic equilibrium price of textiles. As a result, international trade allows sellers of textiles in Country A to experience greater producer surplus than they otherwise would experience.
(True/False)
4.7/5 (28)
Figure 9-14. On the diagram below, Q represents the quantity of crude oil and P represents the price of crude oil. 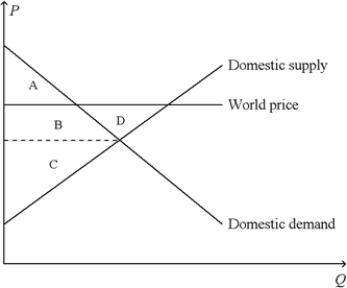 -Refer to Figure 9-14. When the country for which the figure is drawn allows international trade in crude oil,
(Multiple Choice)
5.0/5 (35)
Figure 9-27
The following diagram shows the domestic demand and supply curves in a market. Assume that the world price in this market is $20 per unit. 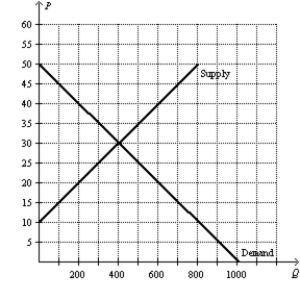 -Refer to Figure 9-27. With no trade allowed, how much are consumer surplus, producer surplus, and total surplus?
(Essay)
4.8/5 (37)
For a country that is considering the adoption of either a tariff or an import quota on a particular good, an important difference is that
(Multiple Choice)
4.9/5 (39)
Figure 9-22
The following diagram shows the domestic demand and domestic supply in a market. In addition, assume that the world price in this market is $40 per unit. 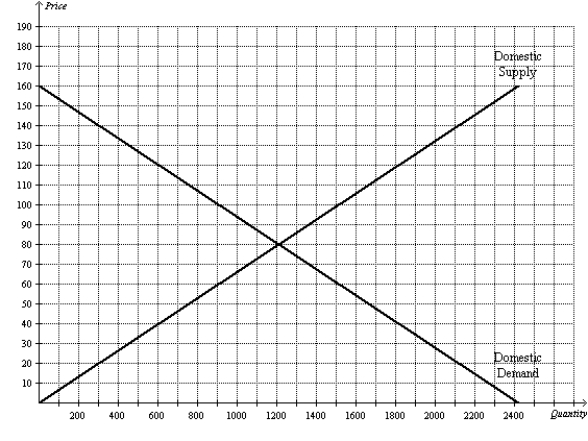 -Refer to Figure 9-22. Suppose the government imposes a tariff of $20 per unit. The amount of revenue collected by the government from the tariff is
(Multiple Choice)
4.7/5 (41)
If Freedonia changes its laws to allow international trade in software and the world price is higher than its domestic price, then it must be the case that
(Multiple Choice)
4.8/5 (29)
Figure 9-27
The following diagram shows the domestic demand and supply curves in a market. Assume that the world price in this market is $20 per unit.
-Refer to Figure 9-27. With no trade allowed, what are the equilibrium price and equilibrium quantity in this market?
(Essay)
4.9/5 (32)
Figure 9-5
The figure illustrates the market for tricycles in a country. 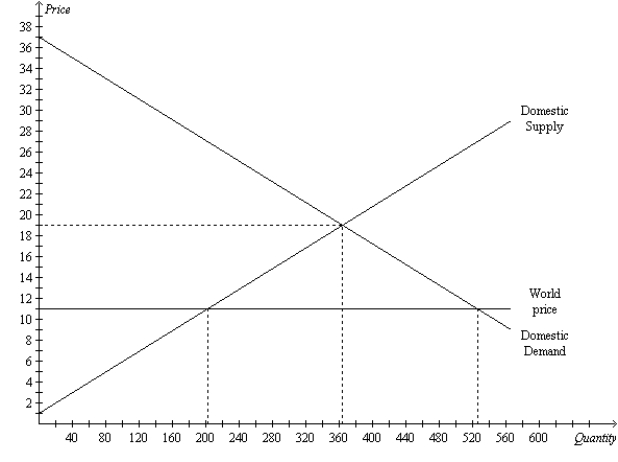 -Refer to Figure 9-5. The horizontal line at the world price of tricycles represents the
(Multiple Choice)
4.9/5 (34)
Refer to Figure 9-15. As a result of the tariff, there is a deadweight loss that amounts to
(Multiple Choice)
4.8/5 (36)
Figure 9-21
The following diagram shows the domestic demand and domestic supply for a market. In addition, assume that the world price in this market is $40 per unit. 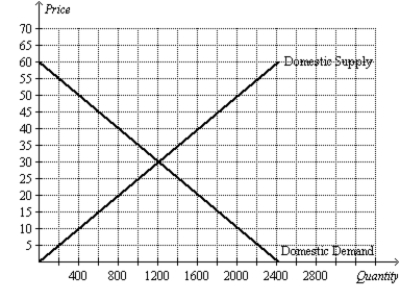 -Refer to Figure 9-21. With free trade, the domestic price and domestic quantity demanded are
(Multiple Choice)
4.9/5 (33)
Figure 9-27
The following diagram shows the domestic demand and supply curves in a market. Assume that the world price in this market is $20 per unit.
-Refer to Figure 9-27. Suppose the country imposes a $5 per unit tariff. If the country allows trade with a tariff, how much is the deadweight loss caused by the tariff?
(Short Answer)
4.8/5 (33)
Figure 9-27
The following diagram shows the domestic demand and supply curves in a market. Assume that the world price in this market is $20 per unit.
-Refer to Figure 9-27. Suppose the country imposes a $5 per unit tariff. If the country allows trade with a tariff, how much are consumer surplus, producer surplus, tariff revenue, and total surplus?
(Essay)
4.7/5 (38)
Figure 9-5
The figure illustrates the market for tricycles in a country.
-Refer to Figure 9-5. Without trade, consumer surplus amounts to
(Multiple Choice)
4.7/5 (37)
Figure 9-28
The following diagram shows the domestic demand and domestic supply curves in a market.  -Refer to Figure 9-28. Suppose the world price in this market is $6. If the country allows free trade, how many units will domestic consumers demand, and how many units will domestic producers supply?
(Essay)
4.8/5 (37)
Filters
- Essay(0)
- Multiple Choice(0)
- Short Answer(0)
- True False(0)
- Matching(0)