Exam 9: Application: International Trade
Exam 1: Ten Principles of Economics455 Questions
Exam 2: Thinking Like an Economist643 Questions
Exam 3: Interdependence and the Gains From Trade547 Questions
Exam 4: The Market Forces of Supply and Demand693 Questions
Exam 5: Elasticity and Its Application626 Questions
Exam 6: Supply, Demand, and Government Policies668 Questions
Exam 7: Consumers, Producers, and the Efficiency of Markets547 Questions
Exam 8: Applications: the Costs of Taxation509 Questions
Exam 9: Application: International Trade521 Questions
Exam 10: Externalities543 Questions
Exam 11: Public Goods and Common Resources452 Questions
Exam 12: The Design of the Tax System664 Questions
Exam 13: The Costs of Production649 Questions
Exam 14: Firms in Competitive Markets604 Questions
Exam 15: Monopoly662 Questions
Exam 16: Monopolistic Competition649 Questions
Exam 17: Oligopoly522 Questions
Exam 18: The Markets for the Factors of Production592 Questions
Exam 19: Earnings and Discrimination511 Questions
Exam 20: Income Inequality and Poverty478 Questions
Exam 21: The Theory of Consumer Choice570 Questions
Exam 22: Frontiers in Microeconomics461 Questions
Exam 23: Measuring a Nation S Income547 Questions
Exam 24: Measuring the Cost of Living565 Questions
Exam 25: Production and Growth527 Questions
Exam 26: Saving, Investment, and the Financial System637 Questions
Exam 27: Tools of Finance534 Questions
Exam 28: Unemployment and Its Natural Rate701 Questions
Exam 29: The Monetary System540 Questions
Exam 30: Money Growth and Inflation504 Questions
Exam 31: Open-Economy Macroeconomics: Basic Concepts540 Questions
Exam 32: A Macroeconomic Theory of the Open Economy511 Questions
Exam 33: Aggregate Demand and Aggregate Supply572 Questions
Exam 34: The Influence of Monetary and Fiscal Policy on Aggregate Demand523 Questions
Exam 35: The Short-Run Tradeoff Between Inflation and Unemployment536 Questions
Exam 36: Six Debates Over Macroeconomic Policy354 Questions
Select questions type
Figure 9-9 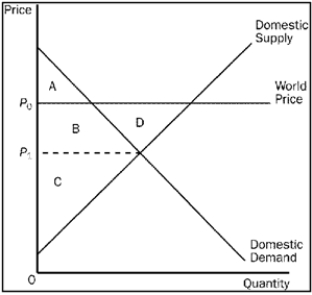 -Refer to Figure 9-9. Total surplus in this market before trade is
(Multiple Choice)
4.7/5  (32)
(32)
Scenario 9-3
Suppose domestic demand and domestic supply in a market are given by the following equations:  -Refer to Scenario 9-3. Suppose the world price in this market is $8 per unit. If the country allows free trade, how much are consumer surplus, producer surplus, and producer surplus with trade?
(Essay)
4.8/5 (37)
Figure 9-26
The diagram below illustrates the market for baseballs in the U.S. 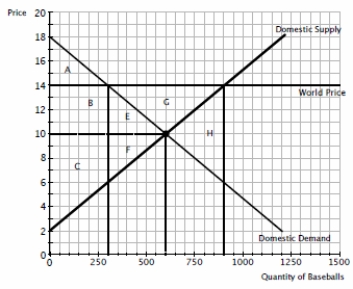 -Refer to Figure 9-26. The figure shows that
(Multiple Choice)
4.9/5 (31)
Figure 9-18. On the diagram below, Q represents the quantity of peaches and P represents the price of peaches. The domestic country is Isoland. 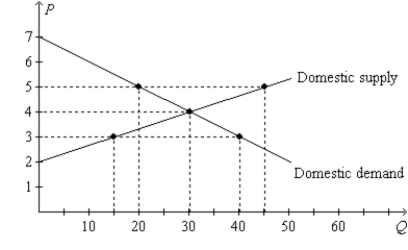 -Refer to Figure 9-18. Suppose Isoland changes from a no-trade policy to a policy that allows international trade. If the world price of peaches is $3, then the policy change results in a
(Multiple Choice)
4.8/5 (39)
The nation of Wheatland forbids international trade. In Wheatland, you can buy 1 pound of corn for 3 pounds of fish. In other countries, you can buy 1 pound of corn for 2 pounds of fish. These facts indicate that
(Multiple Choice)
4.9/5 (28)
When a country allows trade and becomes an exporter of bicycles,
(Multiple Choice)
4.9/5 (30)
Suppose Iceland goes from being an isolated country to being an exporter of coats. As a result,
(Multiple Choice)
4.8/5 (37)
Figure 9-13 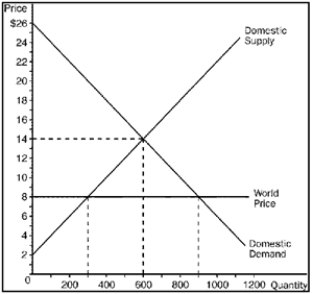 -Refer to Figure 9-13. Consumer surplus after trade is
(Multiple Choice)
4.9/5 (38)
Turkey is an importer of wheat. The world price of a bushel of wheat is $7. Turkey imposes a $3-per-bushel tariff on wheat. Turkey is a price-taker in the wheat market. As a result of the tariff,
(Multiple Choice)
4.7/5 (45)
The before-trade price of fish in Germany is $8.00 per pound. The world price of fish is $6.00 per pound. Germany is a price-taker in the fish market. If Germany allows trade in fish, then Germany will become an
(Multiple Choice)
4.8/5 (31)
Figure 9-9
-Refer to Figure 9-9. Producer surplus in this market before trade is
(Multiple Choice)
4.8/5 (41)
Scenario 9-2
• For a small country called Boxland, the equation of the domestic demand curve for
cardboard is  ,
where
,
where  represents the domestic quantity of cardboard demanded, in tons, and
  represents the price of a ton of cardboard.
• For Boxland, the equation of the domestic supply curve for cardboard is
represents the price of a ton of cardboard.
• For Boxland, the equation of the domestic supply curve for cardboard is  ,
where
,
where  represents the domestic quantity of cardboard supplied, in tons, and
  again
represents the price of a ton of cardboard.
-Refer to Scenario 9-2. Suppose the world price of cardboard is $45. Then, if Boxland goes from prohibiting international trade in cardboard to allowing international trade in cardboard,
again
represents the price of a ton of cardboard.
-Refer to Scenario 9-2. Suppose the world price of cardboard is $45. Then, if Boxland goes from prohibiting international trade in cardboard to allowing international trade in cardboard,
(Multiple Choice)
4.8/5 (27)
For any country, if the world price of copper is lower than the domestic price of copper without trade, that country should
(Multiple Choice)
4.9/5 (30)
Figure 9-26
The following diagram shows the domestic demand and domestic supply curves in a market. 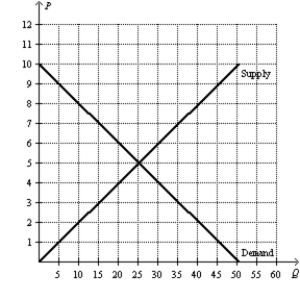 -Refer to Figure 9-26. Suppose the world price in this market is $7. If the country allows free trade, by how much do consumer surplus, producer surplus, and total surplus change with trade?
(Essay)
4.9/5 (39)
Refer to Figure 9-15. Producer surplus with trade and without a tariff is
(Multiple Choice)
5.0/5 (31)
Figure 9-26
The diagram below illustrates the market for baseballs in the U.S.
-Refer to Figure 9-26. As a result of opening up the baseball market to international trade, the U.S. will
(Multiple Choice)
4.8/5 (41)
Economists view the fact that Florida grows oranges, Texas pumps oil, and California makes wine as
(Multiple Choice)
4.8/5 (28)
Use the graph to answer the following questions about CDs. 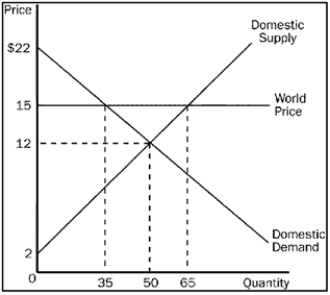 a.What is the equilibrium price of CDs before trade?
b.What is the equilibrium quantity of CDs before trade?
c.What is the price of CDs after trade is allowed?
d.What is the quantity of CDs exported after trade is allowed?
e.What is the amount of consumer surplus before trade?
f. What is the amount of consumer surplus after trade?
g. What is the amount of producer surplus before trade?
h. What is the amount of producer surplus after trade?
i. What is the amount of total surplus before trade?
j. What is the amount of total surplus after trade?
k. What is the change in total surplus because of trade?
a.What is the equilibrium price of CDs before trade?
b.What is the equilibrium quantity of CDs before trade?
c.What is the price of CDs after trade is allowed?
d.What is the quantity of CDs exported after trade is allowed?
e.What is the amount of consumer surplus before trade?
f. What is the amount of consumer surplus after trade?
g. What is the amount of producer surplus before trade?
h. What is the amount of producer surplus after trade?
i. What is the amount of total surplus before trade?
j. What is the amount of total surplus after trade?
k. What is the change in total surplus because of trade?
(Essay)
4.8/5 (31)
William and Jamal live in the country of Dumexia. When Dumexia legalized international trade in bananas, the price of bananas in Dumexia increased. As a result, William became better off and Jamal became worse off. It follows that William is a seller, and Jamal is a buyer, of bananas.
(True/False)
4.8/5 (31)
Filters
- Essay(0)
- Multiple Choice(0)
- Short Answer(0)
- True False(0)
- Matching(0)