Exam 9: Application: International Trade
Exam 1: Ten Principles of Economics455 Questions
Exam 2: Thinking Like an Economist643 Questions
Exam 3: Interdependence and the Gains From Trade547 Questions
Exam 4: The Market Forces of Supply and Demand693 Questions
Exam 5: Elasticity and Its Application626 Questions
Exam 6: Supply, Demand, and Government Policies668 Questions
Exam 7: Consumers, Producers, and the Efficiency of Markets547 Questions
Exam 8: Applications: the Costs of Taxation509 Questions
Exam 9: Application: International Trade521 Questions
Exam 10: Externalities543 Questions
Exam 11: Public Goods and Common Resources452 Questions
Exam 12: The Design of the Tax System664 Questions
Exam 13: The Costs of Production649 Questions
Exam 14: Firms in Competitive Markets604 Questions
Exam 15: Monopoly662 Questions
Exam 16: Monopolistic Competition649 Questions
Exam 17: Oligopoly522 Questions
Exam 18: The Markets for the Factors of Production592 Questions
Exam 19: Earnings and Discrimination511 Questions
Exam 20: Income Inequality and Poverty478 Questions
Exam 21: The Theory of Consumer Choice570 Questions
Exam 22: Frontiers in Microeconomics461 Questions
Exam 23: Measuring a Nation S Income547 Questions
Exam 24: Measuring the Cost of Living565 Questions
Exam 25: Production and Growth527 Questions
Exam 26: Saving, Investment, and the Financial System637 Questions
Exam 27: Tools of Finance534 Questions
Exam 28: Unemployment and Its Natural Rate701 Questions
Exam 29: The Monetary System540 Questions
Exam 30: Money Growth and Inflation504 Questions
Exam 31: Open-Economy Macroeconomics: Basic Concepts540 Questions
Exam 32: A Macroeconomic Theory of the Open Economy511 Questions
Exam 33: Aggregate Demand and Aggregate Supply572 Questions
Exam 34: The Influence of Monetary and Fiscal Policy on Aggregate Demand523 Questions
Exam 35: The Short-Run Tradeoff Between Inflation and Unemployment536 Questions
Exam 36: Six Debates Over Macroeconomic Policy354 Questions
Select questions type
Figure 9-24
The following diagram shows the domestic demand and supply in a market. Assume that the world price in this market is $20 per unit. 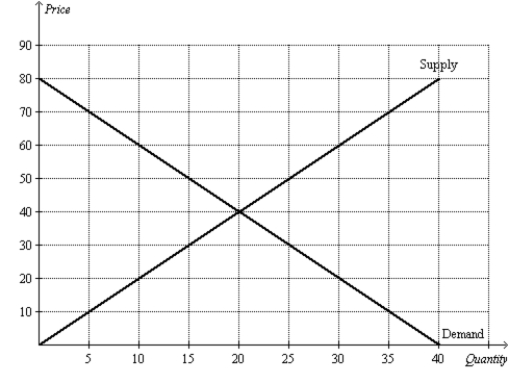 -Refer to Figure 9-24. With free trade, consumer surplus is
(Multiple Choice)
4.9/5  (30)
(30)
Figure 9-6
The figure illustrates the market for roses in a country. 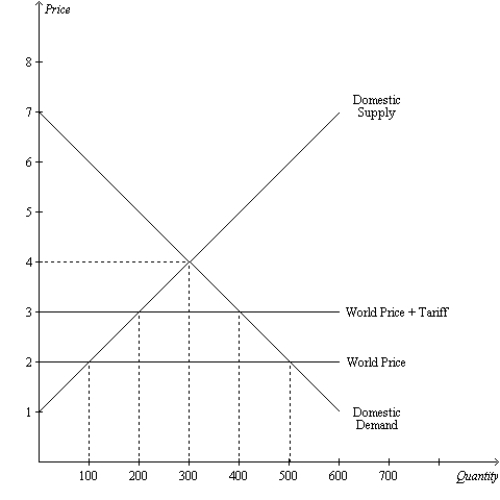 -Refer to Figure 9-6. With trade and without a tariff,
(Multiple Choice)
4.7/5 (35)
Figure 9-10. The figure applies to Mexico and the good is rifles. 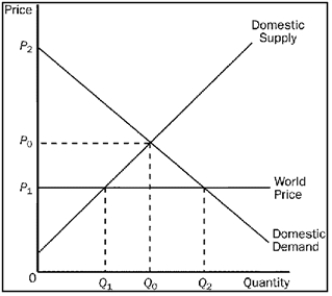 -Refer to Figure 9-10. The area bounded by the points (Q0, P0), (Q2, P1), and (Q1, P1) represents
(Multiple Choice)
4.8/5 (45)
Figure 9-22
The following diagram shows the domestic demand and domestic supply in a market. In addition, assume that the world price in this market is $40 per unit. 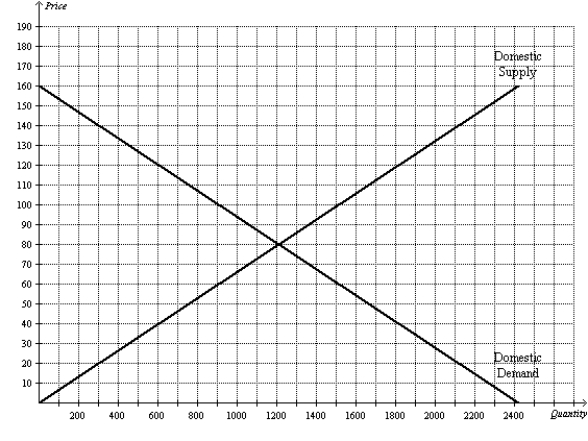 -Refer to Figure 9-22. With free trade, the country imports
(Multiple Choice)
4.9/5 (36)
Scenario 9-3
Suppose domestic demand and domestic supply in a market are given by the following equations:  -Refer to Scenario 9-3. Suppose the world price in this market is $8 per unit, and suppose the country imposes a $1 per unit tariff. If the country allows trade with a tariff, how much is the deadweight loss caused by the tariff?
(Essay)
4.8/5 (35)
If Freedonia changes its laws to allow international trade in software and the world price is lower than its domestic price, then it must be the case that
(Multiple Choice)
4.9/5 (44)
Figure 9-3. The domestic country is China. 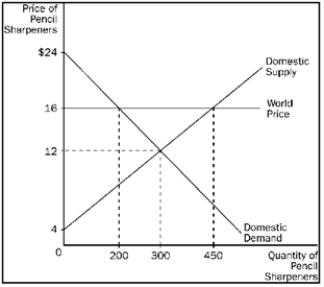 -Refer to Figure 9-3. The increase in total surplus in China when trade is allowed is
(Multiple Choice)
4.8/5 (29)
Scenario 9-2
• For a small country called Boxland, the equation of the domestic demand curve for
cardboard is  ,
where
,
where  represents the domestic quantity of cardboard demanded, in tons, and
  represents the price of a ton of cardboard.
• For Boxland, the equation of the domestic supply curve for cardboard is
represents the price of a ton of cardboard.
• For Boxland, the equation of the domestic supply curve for cardboard is  ,
where
,
where  represents the domestic quantity of cardboard supplied, in tons, and
  again
represents the price of a ton of cardboard.
-Refer to Scenario 9-2. If Boxland prohibits international trade in cardboard, then the equilibrium price of a ton of cardboard is
again
represents the price of a ton of cardboard.
-Refer to Scenario 9-2. If Boxland prohibits international trade in cardboard, then the equilibrium price of a ton of cardboard is
(Multiple Choice)
4.8/5 (29)
Scenario 9-1
The before-trade domestic price of peaches in the United States is $40 per bushel. The world price of peaches is $52 per bushel. The U.S. is a price-taker in the market for peaches.
-Refer to Scenario 9-1. If trade in peaches is allowed, the United States
(Multiple Choice)
4.8/5 (25)
Figure 9-13 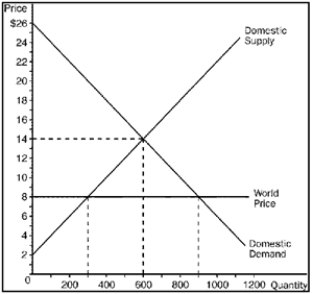 -Refer to Figure 9-13. Producer surplus before trade is
(Multiple Choice)
4.8/5 (37)
Scenario 9-1
The before-trade domestic price of peaches in the United States is $40 per bushel. The world price of peaches is $52 per bushel. The U.S. is a price-taker in the market for peaches.
-Refer to Scenario 9-1. If trade in peaches is allowed, the price of peaches in the United States
(Multiple Choice)
4.9/5 (31)
When a country abandons a no-trade policy, adopts a free-trade policy, and becomes an exporter of a particular good,
(Multiple Choice)
4.8/5 (35)
Refer to Figure 9-15. With the tariff, the quantity of saddles imported is
(Multiple Choice)
4.8/5 (31)
Figure 9-19. On the diagram below, Q represents the quantity of textiles and P represents the price of textiles. 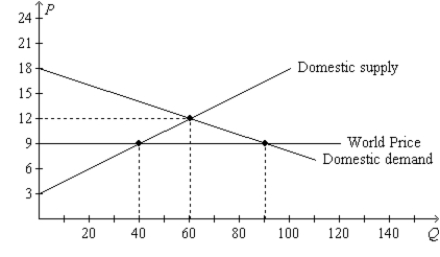 -Refer to Figure 9-19. With free trade, consumer surplus in the textile market amounts to
(Multiple Choice)
4.8/5 (39)
When a country that exported a particular good abandons a free-trade policy and adopts a no-trade policy,
(Multiple Choice)
4.8/5 (37)
Figure 9-21
The following diagram shows the domestic demand and domestic supply for a market. In addition, assume that the world price in this market is $40 per unit. 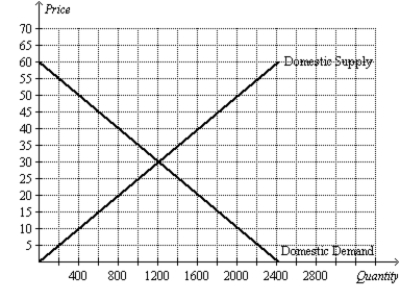 -Refer to Figure 9-21. Consumer surplus with free trade is
(Multiple Choice)
5.0/5 (27)
Figure 9-26
The diagram below illustrates the market for baseballs in the U.S. 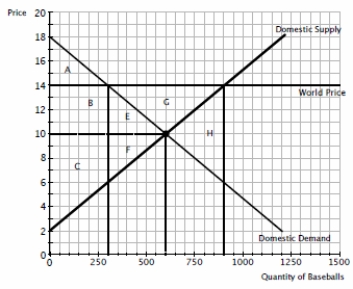 -Refer to figure 9-26. After the opening of the baseball market to international trade, producer surplus in the U.S.
(Multiple Choice)
4.7/5 (33)
Economists feel that national security concerns never provide a legitimate rationale for trade restrictions.
(True/False)
4.8/5 (32)
Filters
- Essay(0)
- Multiple Choice(0)
- Short Answer(0)
- True False(0)
- Matching(0)