Exam 9: Application: International Trade
Exam 1: Ten Principles of Economics455 Questions
Exam 2: Thinking Like an Economist643 Questions
Exam 3: Interdependence and the Gains From Trade547 Questions
Exam 4: The Market Forces of Supply and Demand693 Questions
Exam 5: Elasticity and Its Application626 Questions
Exam 6: Supply, Demand, and Government Policies668 Questions
Exam 7: Consumers, Producers, and the Efficiency of Markets547 Questions
Exam 8: Applications: the Costs of Taxation509 Questions
Exam 9: Application: International Trade521 Questions
Exam 10: Externalities543 Questions
Exam 11: Public Goods and Common Resources452 Questions
Exam 12: The Design of the Tax System664 Questions
Exam 13: The Costs of Production649 Questions
Exam 14: Firms in Competitive Markets604 Questions
Exam 15: Monopoly662 Questions
Exam 16: Monopolistic Competition649 Questions
Exam 17: Oligopoly522 Questions
Exam 18: The Markets for the Factors of Production592 Questions
Exam 19: Earnings and Discrimination511 Questions
Exam 20: Income Inequality and Poverty478 Questions
Exam 21: The Theory of Consumer Choice570 Questions
Exam 22: Frontiers in Microeconomics461 Questions
Exam 23: Measuring a Nation S Income547 Questions
Exam 24: Measuring the Cost of Living565 Questions
Exam 25: Production and Growth527 Questions
Exam 26: Saving, Investment, and the Financial System637 Questions
Exam 27: Tools of Finance534 Questions
Exam 28: Unemployment and Its Natural Rate701 Questions
Exam 29: The Monetary System540 Questions
Exam 30: Money Growth and Inflation504 Questions
Exam 31: Open-Economy Macroeconomics: Basic Concepts540 Questions
Exam 32: A Macroeconomic Theory of the Open Economy511 Questions
Exam 33: Aggregate Demand and Aggregate Supply572 Questions
Exam 34: The Influence of Monetary and Fiscal Policy on Aggregate Demand523 Questions
Exam 35: The Short-Run Tradeoff Between Inflation and Unemployment536 Questions
Exam 36: Six Debates Over Macroeconomic Policy354 Questions
Select questions type
Scenario 9-2
• For a small country called Boxland, the equation of the domestic demand curve for
cardboard is  ,
where
,
where  represents the domestic quantity of cardboard demanded, in tons, and
  represents the price of a ton of cardboard.
• For Boxland, the equation of the domestic supply curve for cardboard is
represents the price of a ton of cardboard.
• For Boxland, the equation of the domestic supply curve for cardboard is  ,
where
,
where  represents the domestic quantity of cardboard supplied, in tons, and
  again
represents the price of a ton of cardboard.
-Refer to Scenario 9-2. Suppose the world price of cardboard is $60. Then, relative to the no-trade situation, international trade in cardboard produces which of the following results for Boxland?
again
represents the price of a ton of cardboard.
-Refer to Scenario 9-2. Suppose the world price of cardboard is $60. Then, relative to the no-trade situation, international trade in cardboard produces which of the following results for Boxland?
(Multiple Choice)
4.8/5  (40)
(40)
Figure 9-17 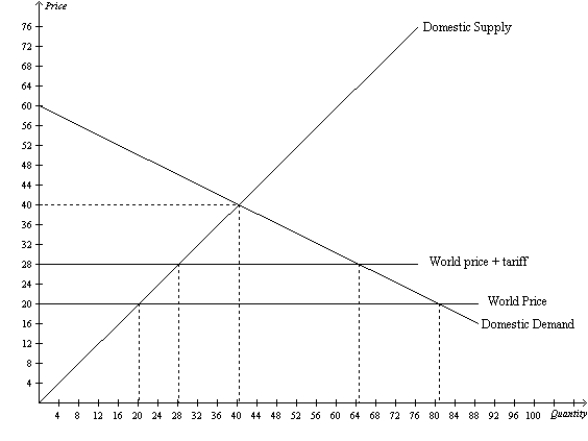 -Refer to Figure 9-17. With free trade, total surplus is
(Multiple Choice)
5.0/5 (39)
Which of the following is not an advantage of a multilateral approach to free trade over a unilateral approach?
(Multiple Choice)
4.9/5 (43)
After a certain nation changed its policy from one that banned international trade in wheat to one that allowed international trade in wheat, the nation began importing wheat. As a result, total surplus in the wheat market increased by $10 million. Which of the following changes could have occurred as well?
(Multiple Choice)
4.8/5 (38)
Scenario 9-2
• For a small country called Boxland, the equation of the domestic demand curve for
cardboard is ,
where represents the domestic quantity of cardboard demanded, in tons, and represents the price of a ton of cardboard.
• For Boxland, the equation of the domestic supply curve for cardboard is ,
where represents the domestic quantity of cardboard supplied, in tons, and again
represents the price of a ton of cardboard.
-Refer to Scenario 9-2. Suppose the world price of cardboard is $60. Then, relative to the no-trade situation, international trade in cardboard
(Multiple Choice)
4.8/5 (32)
Figure 9-29
The following diagram shows the domestic demand and domestic supply curves in a market. Assume that the world price in this market is $1 per unit. 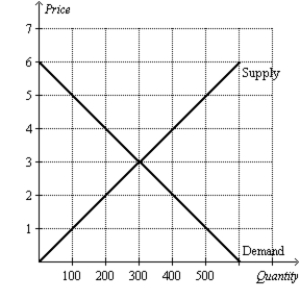 -Refer to Figure 9-29. Suppose the country imposes a $1 per unit tariff. If the country allows trade with a tariff, how much is tariff revenue?
(Essay)
4.8/5 (45)
When a country opens up to trade in a good for which it has a comparative advantage, and the country begins to export the good, we can conclude that
(Multiple Choice)
4.8/5 (38)
Within a country, the domestic price of a product will equal the world price if
(Multiple Choice)
4.8/5 (34)
If the Korean steel industry subsidizes the steel that it sells to the United States, the
(Multiple Choice)
4.7/5 (34)
Spain allows trade with the rest of the world. We know that Spain has a comparative advantage in producing olive oil if we know that
(Multiple Choice)
4.8/5 (32)
Figure 9-29
The following diagram shows the domestic demand and domestic supply curves in a market. Assume that the world price in this market is $1 per unit.
-Refer to Figure 9-29. If the country allows free trade, how many units will domestic consumers demand and how many units will domestic producers supply?
(Essay)
4.7/5 (34)
Figure 9-25
The following diagram shows the domestic demand and supply in a market. Assume that the world price in this market is $10 per unit. 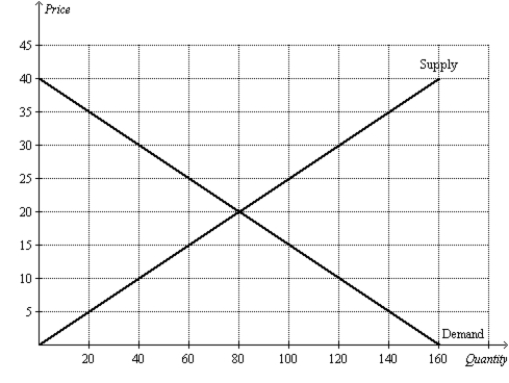 -Refer to Figure 9-25. With free trade, total surplus is
(Multiple Choice)
4.7/5 (36)
When a country allows trade and becomes an importer of bottled water, which of the following is not a consequence?
(Multiple Choice)
4.8/5 (43)
Assume, for England, that the domestic price of wine without international trade is higher than the world price of wine. This suggests that, in the production of wine,
(Multiple Choice)
4.9/5 (29)
Suppose Ireland exports beer to China and imports pineapples from the United States. This situation suggests that
(Multiple Choice)
4.9/5 (38)
Figure 9-26
The following diagram shows the domestic demand and domestic supply curves in a market. 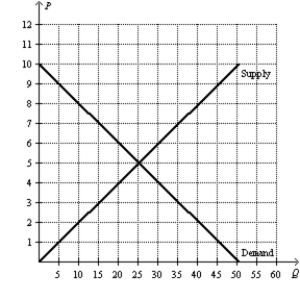 -Refer to Figure 9-26. With no trade allowed, what are the equilibrium price and equilibrium quantity in this market?
(Essay)
4.7/5 (38)
Figure 9-5
The figure illustrates the market for tricycles in a country. 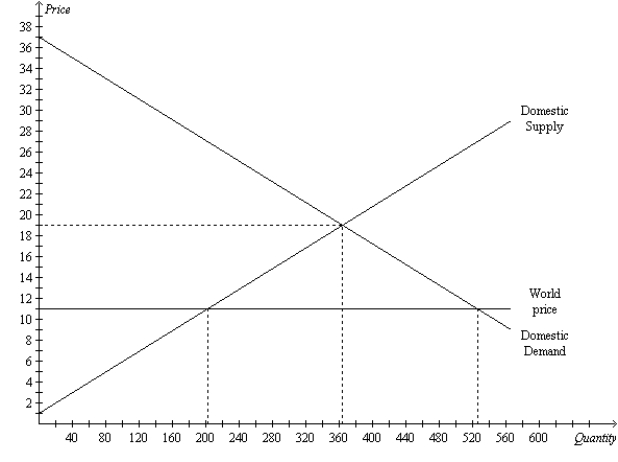 -Refer to Figure 9-5. If this country allows free trade in tricycles,
(Multiple Choice)
4.9/5 (42)
Japan imposes a $300 per ton tariff on imported steel, raising the price charged in Japan to $1,000. Using only this information, which of the following statements is correct?
(Multiple Choice)
4.8/5 (43)
Suppose in the country of Nash that the price of oranges is $8 per bushel with no trade allowed. If the world price of oranges is $10 per bushel and if Nash allows free trade, will Nash be an importer or an exporter of oranges?
(Short Answer)
4.8/5 (33)
Suppose France subsidizes French wheat farmers, while Germany offers no subsidy to German wheat farmers. As a result of the French subsidy, sales of French wheat to Germany
(Multiple Choice)
4.9/5 (42)
Filters
- Essay(0)
- Multiple Choice(0)
- Short Answer(0)
- True False(0)
- Matching(0)