Exam 9: Application: International Trade
Exam 1: Ten Principles of Economics455 Questions
Exam 2: Thinking Like an Economist643 Questions
Exam 3: Interdependence and the Gains From Trade547 Questions
Exam 4: The Market Forces of Supply and Demand693 Questions
Exam 5: Elasticity and Its Application626 Questions
Exam 6: Supply, Demand, and Government Policies668 Questions
Exam 7: Consumers, Producers, and the Efficiency of Markets547 Questions
Exam 8: Applications: the Costs of Taxation509 Questions
Exam 9: Application: International Trade521 Questions
Exam 10: Externalities543 Questions
Exam 11: Public Goods and Common Resources452 Questions
Exam 12: The Design of the Tax System664 Questions
Exam 13: The Costs of Production649 Questions
Exam 14: Firms in Competitive Markets604 Questions
Exam 15: Monopoly662 Questions
Exam 16: Monopolistic Competition649 Questions
Exam 17: Oligopoly522 Questions
Exam 18: The Markets for the Factors of Production592 Questions
Exam 19: Earnings and Discrimination511 Questions
Exam 20: Income Inequality and Poverty478 Questions
Exam 21: The Theory of Consumer Choice570 Questions
Exam 22: Frontiers in Microeconomics461 Questions
Exam 23: Measuring a Nation S Income547 Questions
Exam 24: Measuring the Cost of Living565 Questions
Exam 25: Production and Growth527 Questions
Exam 26: Saving, Investment, and the Financial System637 Questions
Exam 27: Tools of Finance534 Questions
Exam 28: Unemployment and Its Natural Rate701 Questions
Exam 29: The Monetary System540 Questions
Exam 30: Money Growth and Inflation504 Questions
Exam 31: Open-Economy Macroeconomics: Basic Concepts540 Questions
Exam 32: A Macroeconomic Theory of the Open Economy511 Questions
Exam 33: Aggregate Demand and Aggregate Supply572 Questions
Exam 34: The Influence of Monetary and Fiscal Policy on Aggregate Demand523 Questions
Exam 35: The Short-Run Tradeoff Between Inflation and Unemployment536 Questions
Exam 36: Six Debates Over Macroeconomic Policy354 Questions
Select questions type
Import quotas and tariffs produce some common results. Which of the following is not one of those common results?
(Multiple Choice)
4.8/5  (35)
(35)
The world price of a pound of almonds is $4.50. Before Uruguay allowed trade in almonds, the price of a pound of almonds there was $3.00. Once Uruguay began allowing trade in almonds with other countries, Uruguay began
(Multiple Choice)
4.8/5 (33)
Figure 9-1
The figure illustrates the market for coffee in Guatemala. 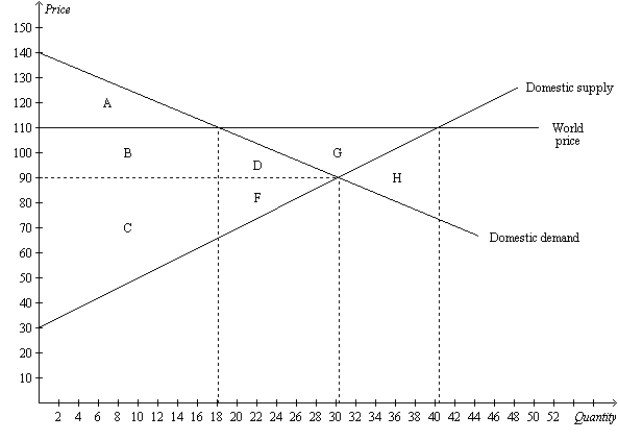 -Refer to Figure 9-1. In the absence of trade, total surplus in the Guatemalan coffee market amounts to
(Multiple Choice)
4.9/5 (40)
Suppose Brazil has a comparative advantage over other countries in producing almonds, but other countries have an absolute advantage over Brazil in producing almonds. If trade in almonds is allowed, Brazil
(Multiple Choice)
4.8/5 (33)
Figure 9-28
The following diagram shows the domestic demand and domestic supply curves in a market. 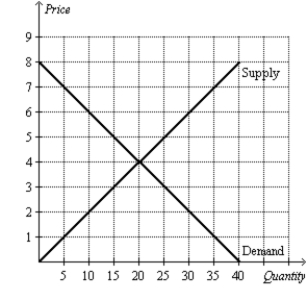 -Refer to Figure 9-28. Suppose the world price in this market is $6. If the country allows free trade, how much is producer surplus?
(Short Answer)
4.8/5 (35)
Figure 9-5
The figure illustrates the market for tricycles in a country. 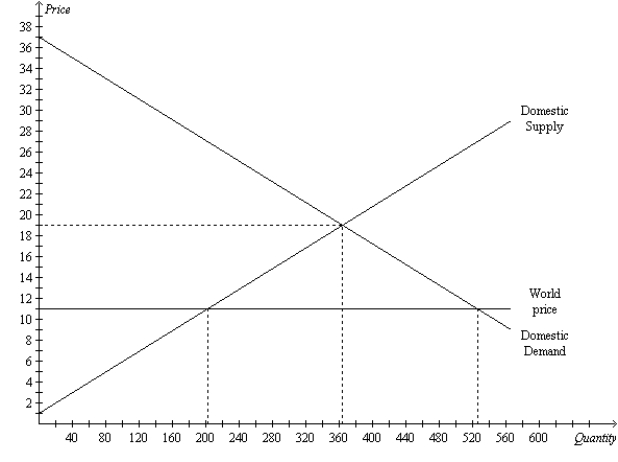 -Refer to Figure 9-5. Bearing in mind that this country is "small," which of the following events conceivably could cause the country to switch from being an importer of tricycles to an exporter of tricycles?
(Multiple Choice)
4.9/5 (32)
Figure 9-28
The following diagram shows the domestic demand and domestic supply curves in a market.
-Refer to Figure 9-28. Suppose the world price in this market is $6. If the country allows free trade, how much is total surplus?
(Short Answer)
4.9/5 (35)
Figure 9-24
The following diagram shows the domestic demand and supply in a market. Assume that the world price in this market is $20 per unit. 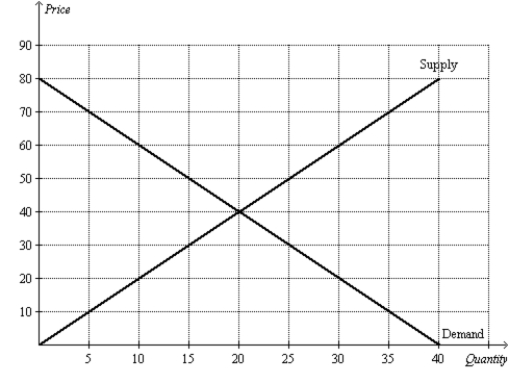 -Refer to Figure 9-24. With free trade, the country
(Multiple Choice)
4.8/5 (24)
Congressman Smith cites the "jobs argument" when he argues in favor of restrictions on trade; he argues that everything can be produced at lower cost in other countries. The likely flaw in Congressman Smith's reasoning is that he ignores the fact that
(Multiple Choice)
4.8/5 (28)
Figure 9-3. The domestic country is China. 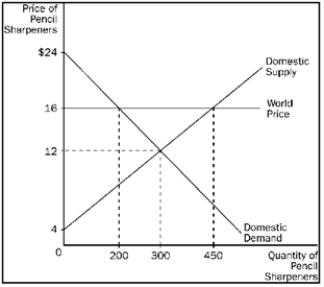 -Refer to Figure 9-3. Relative to a no-trade situation, which of the following comes with trade?
(Multiple Choice)
4.7/5 (30)
Figure 9-7. The figure applies to the nation of Wales and the good is cheese. 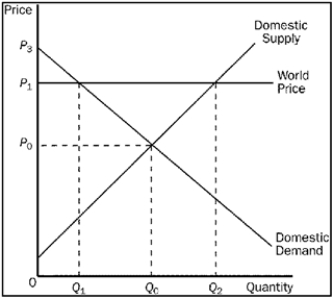 -Refer to Figure 9-7. The equilibrium price and the equilibrium quantity of cheese in Wales before trade are
(Multiple Choice)
4.9/5 (22)
When a country that imports shoes imposes a tariff on shoes, buyers of shoes in that country become worse off.
(True/False)
4.7/5 (39)
Figure 9-3. The domestic country is China.
-Refer to Figure 9-3. With trade, China will
(Multiple Choice)
4.8/5 (41)
When a nation first begins to trade with other countries and the nation becomes an importer of corn,
(Multiple Choice)
4.8/5 (30)
"Owners of firms in young industries should be willing to incur temporary losses if they believe that those firms will be profitable in the long run." This observation helps to explain why many economists are skeptical about the
(Multiple Choice)
4.9/5 (48)
Figure 9-28
The following diagram shows the domestic demand and domestic supply curves in a market.
-Refer to Figure 9-28. Suppose the world price in this market is $6. If the country allows free trade, how much is consumer surplus?
(Short Answer)
4.8/5 (37)
Scenario 9-2
• For a small country called Boxland, the equation of the domestic demand curve for
cardboard is  ,
where
,
where  represents the domestic quantity of cardboard demanded, in tons, and
  represents the price of a ton of cardboard.
• For Boxland, the equation of the domestic supply curve for cardboard is
represents the price of a ton of cardboard.
• For Boxland, the equation of the domestic supply curve for cardboard is  ,
where
,
where  represents the domestic quantity of cardboard supplied, in tons, and
  again
represents the price of a ton of cardboard.
-Refer to Scenario 9-2. Suppose the world price of cardboard is $60. Then, if Boxland goes from prohibiting international trade in cardboard to allowing international trade in cardboard,
again
represents the price of a ton of cardboard.
-Refer to Scenario 9-2. Suppose the world price of cardboard is $60. Then, if Boxland goes from prohibiting international trade in cardboard to allowing international trade in cardboard,
(Multiple Choice)
4.9/5 (36)
When a country allows trade and becomes an exporter of a good,
(Multiple Choice)
5.0/5 (32)
Figure 9-23
The following diagram shows the domestic demand and domestic supply for a market. Assume that the world price in this market is $120 per unit. 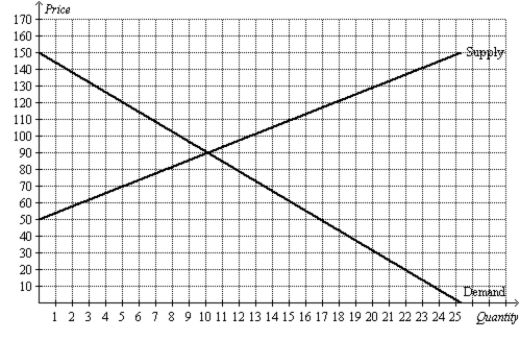 -Refer to Figure 9-23. Consumer surplus with free trade is
(Multiple Choice)
4.8/5 (44)
Figure 9-25
The following diagram shows the domestic demand and supply in a market. Assume that the world price in this market is $10 per unit. 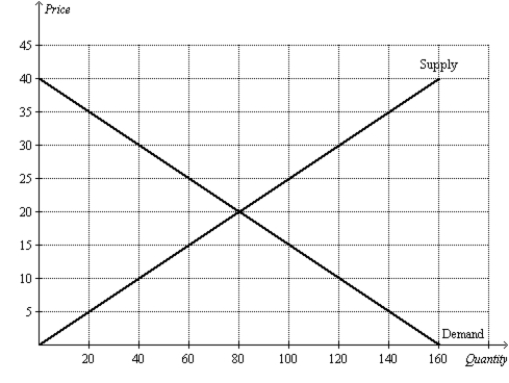 -Refer to Figure 9-25. Suppose the government imposes a tariff of $5 per unit. The amount of revenue collected by the government from the tariff is
(Multiple Choice)
4.9/5 (32)
Filters
- Essay(0)
- Multiple Choice(0)
- Short Answer(0)
- True False(0)
- Matching(0)