Exam 35: The Short-Run Tradeoff Between Inflation and Unemployment
Exam 1: Ten Principles of Economics455 Questions
Exam 2: Thinking Like an Economist643 Questions
Exam 3: Interdependence and the Gains From Trade547 Questions
Exam 4: The Market Forces of Supply and Demand693 Questions
Exam 5: Elasticity and Its Application626 Questions
Exam 6: Supply, Demand, and Government Policies668 Questions
Exam 7: Consumers, Producers, and the Efficiency of Markets547 Questions
Exam 8: Applications: the Costs of Taxation509 Questions
Exam 9: Application: International Trade521 Questions
Exam 10: Externalities543 Questions
Exam 11: Public Goods and Common Resources452 Questions
Exam 12: The Design of the Tax System664 Questions
Exam 13: The Costs of Production649 Questions
Exam 14: Firms in Competitive Markets604 Questions
Exam 15: Monopoly662 Questions
Exam 16: Monopolistic Competition649 Questions
Exam 17: Oligopoly522 Questions
Exam 18: The Markets for the Factors of Production592 Questions
Exam 19: Earnings and Discrimination511 Questions
Exam 20: Income Inequality and Poverty478 Questions
Exam 21: The Theory of Consumer Choice570 Questions
Exam 22: Frontiers in Microeconomics461 Questions
Exam 23: Measuring a Nation S Income547 Questions
Exam 24: Measuring the Cost of Living565 Questions
Exam 25: Production and Growth527 Questions
Exam 26: Saving, Investment, and the Financial System637 Questions
Exam 27: Tools of Finance534 Questions
Exam 28: Unemployment and Its Natural Rate701 Questions
Exam 29: The Monetary System540 Questions
Exam 30: Money Growth and Inflation504 Questions
Exam 31: Open-Economy Macroeconomics: Basic Concepts540 Questions
Exam 32: A Macroeconomic Theory of the Open Economy511 Questions
Exam 33: Aggregate Demand and Aggregate Supply572 Questions
Exam 34: The Influence of Monetary and Fiscal Policy on Aggregate Demand523 Questions
Exam 35: The Short-Run Tradeoff Between Inflation and Unemployment536 Questions
Exam 36: Six Debates Over Macroeconomic Policy354 Questions
Select questions type
In the long run, policy that changes aggregate demand changes
(Multiple Choice)
4.9/5  (42)
(42)
If the central bank increases the money supply, in the short run, the price level
(Multiple Choice)
5.0/5 (32)
Soon after he became the chairman of the Federal Reserve System in 1979, Paul Volcker embarked on a course
(Multiple Choice)
4.8/5 (41)
According to the Phillips curve diagram, if a central bank disinflates what ultimately happens to the unemployment rate?
(Short Answer)
4.9/5 (44)
If people believe that the central bank is going to reduce inflation, then
(Multiple Choice)
4.8/5 (44)
How are the effects of the financial crisis shown using the Phillips curve diagram?
(Essay)
4.9/5 (32)
In the Friedman-Phelps analysis, when inflation is less than expected, the unemployment rate is less than the natural rate.
(True/False)
4.9/5 (39)
A policy intended to reduce unemployment by taking advantage of a tradeoff between inflation and unemployment leads to
(Multiple Choice)
4.9/5 (33)
In the long run, which of the following would shift the long-run Phillips curve to the right?
(Multiple Choice)
4.8/5 (41)
Suppose a recession in Europe reduces U.S. net exports at every price level. Which of the following would you expect to occur in the U.S. as a result of this change?
(Multiple Choice)
4.9/5 (39)
Figure 35-1. The left-hand graph shows a short-run aggregate-supply (SRAS) curve and two aggregate-demand (AD) curves. On the right-hand diagram, U represents the unemployment rate. 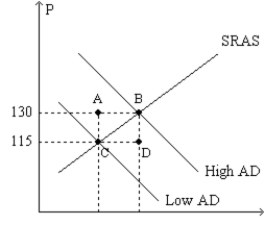
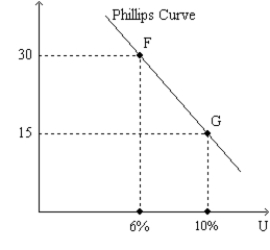 -Refer to Figure 35-1. Suppose points F and G on the right-hand graph represent two possible outcomes for an imaginary economy in the year 2012, and those two points correspond to points B and C, respectively, on the left-hand graph. Also suppose we know that the price index equaled 120 in 2011. Then the numbers 115 and 130 on the vertical axis of the left-hand graph would have to be replaced by
(Multiple Choice)
4.8/5 (40)
A movement to the left along a given short-run Phillips curve could be caused by
(Multiple Choice)
4.7/5 (47)
U.S. monetary policy in the early 1980s reduced the inflation rate by more than half.
(True/False)
4.9/5 (38)
Government expenditures increase. What happens to the price level and output? Explain how the change in the price level and output effect the inflation rate and the unemployment rate.
(Essay)
4.8/5 (35)
An adverse supply shock shifts the short-run Phillips curve to the left.
(True/False)
4.9/5 (32)
If policymakers increase aggregate demand, then in the short run the price level
(Multiple Choice)
4.8/5 (44)
Suppose Congress passes an investment tax credit that increases the quantity of investment goods that firms demand at any given interest rate. Which of the following would you expect to occur as a result of this change?
(Multiple Choice)
4.8/5 (46)
Filters
- Essay(0)
- Multiple Choice(0)
- Short Answer(0)
- True False(0)
- Matching(0)