Exam 35: The Short-Run Tradeoff Between Inflation and Unemployment
Exam 1: Ten Principles of Economics455 Questions
Exam 2: Thinking Like an Economist643 Questions
Exam 3: Interdependence and the Gains From Trade547 Questions
Exam 4: The Market Forces of Supply and Demand693 Questions
Exam 5: Elasticity and Its Application626 Questions
Exam 6: Supply, Demand, and Government Policies668 Questions
Exam 7: Consumers, Producers, and the Efficiency of Markets547 Questions
Exam 8: Applications: the Costs of Taxation509 Questions
Exam 9: Application: International Trade521 Questions
Exam 10: Externalities543 Questions
Exam 11: Public Goods and Common Resources452 Questions
Exam 12: The Design of the Tax System664 Questions
Exam 13: The Costs of Production649 Questions
Exam 14: Firms in Competitive Markets604 Questions
Exam 15: Monopoly662 Questions
Exam 16: Monopolistic Competition649 Questions
Exam 17: Oligopoly522 Questions
Exam 18: The Markets for the Factors of Production592 Questions
Exam 19: Earnings and Discrimination511 Questions
Exam 20: Income Inequality and Poverty478 Questions
Exam 21: The Theory of Consumer Choice570 Questions
Exam 22: Frontiers in Microeconomics461 Questions
Exam 23: Measuring a Nation S Income547 Questions
Exam 24: Measuring the Cost of Living565 Questions
Exam 25: Production and Growth527 Questions
Exam 26: Saving, Investment, and the Financial System637 Questions
Exam 27: Tools of Finance534 Questions
Exam 28: Unemployment and Its Natural Rate701 Questions
Exam 29: The Monetary System540 Questions
Exam 30: Money Growth and Inflation504 Questions
Exam 31: Open-Economy Macroeconomics: Basic Concepts540 Questions
Exam 32: A Macroeconomic Theory of the Open Economy511 Questions
Exam 33: Aggregate Demand and Aggregate Supply572 Questions
Exam 34: The Influence of Monetary and Fiscal Policy on Aggregate Demand523 Questions
Exam 35: The Short-Run Tradeoff Between Inflation and Unemployment536 Questions
Exam 36: Six Debates Over Macroeconomic Policy354 Questions
Select questions type
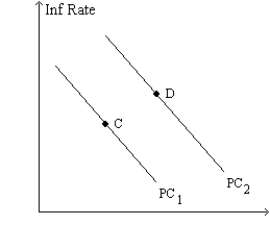
Figure 35-9. The left-hand graph shows a short-run aggregate-supply (SRAS) curve and two aggregate-demand (AD) curves. On the right-hand diagram, "Inf Rate" means "Inflation Rate." 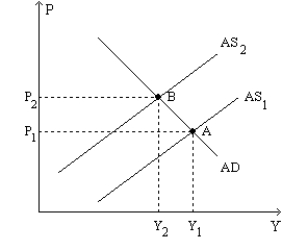
 -Refer to Figure 35-9. Which of the following events could explain the shift of the aggregate-supply curve from AS1 to AS2?
(Multiple Choice)
4.8/5  (29)
(29)
If the Fed wants to reverse the effects of a favorable supply shock on the inflation rate, it should
(Multiple Choice)
4.8/5 (32)
If a central bank reduces inflation 2 percentage points and this makes output fall 3 percentage points and unemployment rise 5 percentage points for one year, the sacrifice ratio is
(Multiple Choice)
4.9/5 (35)
The "natural" rate of unemployment is the unemployment rate toward which the economy gravitates in the
(Multiple Choice)
4.9/5 (43)
Suppose that a small economy that produces mostly agricultural goods experiences a year with exceptionally good conditions for growing crops. The good weather would
(Multiple Choice)
4.8/5 (33)
In responding to the Phillips curve hypothesis, Friedman argued that the Fed can peg the
(Multiple Choice)
4.8/5 (41)
How is a decrease in the natural rate of unemployment shown in the Phillips curve diagram? Does this decrease change the inflation rate?
(Essay)
4.7/5 (43)
Suppose that the money supply increases. In the short run, this increases prices according to
(Multiple Choice)
4.7/5 (32)
Natural rate of unemployment - a × (Αctual inflation - Expected inflation) =
(Multiple Choice)
4.9/5 (33)
The economist A.W. Phillips published a famous article in 1958 in which he showed a
(Multiple Choice)
4.7/5 (30)
In response to the financial crisis of 2007-2008, policymakers used
(Multiple Choice)
4.9/5 (41)
One determinant of the natural rate of unemployment is the
(Multiple Choice)
4.9/5 (42)
Proponents of rational expectations argue that failing to account for peoples' revised inflation expectations led to estimates of the sacrifice ratio that were too high.
(True/False)
4.9/5 (36)
When they are confronted with an adverse shock to aggregate supply, policymakers face a difficult choice in that
(Multiple Choice)
4.8/5 (32)
Figure 35-9. The left-hand graph shows a short-run aggregate-supply (SRAS) curve and two aggregate-demand (AD) curves. On the right-hand diagram, "Inf Rate" means "Inflation Rate."
-Refer to Figure 35-9. The shift of the aggregate-supply curve from AS1 to AS2 could be a consequence of
(Multiple Choice)
4.9/5 (33)
Which of the following would shift the long-run Phillips curve to the right?
(Multiple Choice)
4.8/5 (33)
Figure 35-4. The left-hand graph shows a short-run aggregate-supply (SRAS) curve and two aggregate-demand (AD) curves. On the left-hand diagram, the price level is measured on the vertical axis; on the right-hand diagram, the inflation rate is measured on the vertical axis. 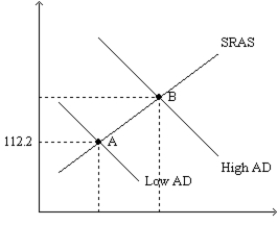
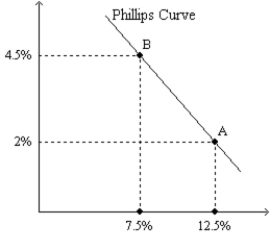 -Refer to Figure 35-4. Assume the figure depicts possible outcomes for the year 2018. In 2018, the economy is at point A on the left-hand graph, which corresponds to point A on the right-hand graph. The price level in the year 2017 was
(Multiple Choice)
4.8/5 (30)
Suppose that the economy is at an inflation rate such that unemployment is above the natural rate. How does the economy return to the natural rate of unemployment if this lower inflation rate persists? Use sticky-wage theory to explain your answer.
(Essay)
4.7/5 (38)
If inflation expectations rise, the short-run Phillips curve shifts
(Multiple Choice)
4.8/5 (37)
If an increase in inflation permanently reduced unemployment, then
(Multiple Choice)
4.7/5 (31)
Filters
- Essay(0)
- Multiple Choice(0)
- Short Answer(0)
- True False(0)
- Matching(0)