Exam 35: The Short-Run Tradeoff Between Inflation and Unemployment
Exam 1: Ten Principles of Economics455 Questions
Exam 2: Thinking Like an Economist643 Questions
Exam 3: Interdependence and the Gains From Trade547 Questions
Exam 4: The Market Forces of Supply and Demand693 Questions
Exam 5: Elasticity and Its Application626 Questions
Exam 6: Supply, Demand, and Government Policies668 Questions
Exam 7: Consumers, Producers, and the Efficiency of Markets547 Questions
Exam 8: Applications: the Costs of Taxation509 Questions
Exam 9: Application: International Trade521 Questions
Exam 10: Externalities543 Questions
Exam 11: Public Goods and Common Resources452 Questions
Exam 12: The Design of the Tax System664 Questions
Exam 13: The Costs of Production649 Questions
Exam 14: Firms in Competitive Markets604 Questions
Exam 15: Monopoly662 Questions
Exam 16: Monopolistic Competition649 Questions
Exam 17: Oligopoly522 Questions
Exam 18: The Markets for the Factors of Production592 Questions
Exam 19: Earnings and Discrimination511 Questions
Exam 20: Income Inequality and Poverty478 Questions
Exam 21: The Theory of Consumer Choice570 Questions
Exam 22: Frontiers in Microeconomics461 Questions
Exam 23: Measuring a Nation S Income547 Questions
Exam 24: Measuring the Cost of Living565 Questions
Exam 25: Production and Growth527 Questions
Exam 26: Saving, Investment, and the Financial System637 Questions
Exam 27: Tools of Finance534 Questions
Exam 28: Unemployment and Its Natural Rate701 Questions
Exam 29: The Monetary System540 Questions
Exam 30: Money Growth and Inflation504 Questions
Exam 31: Open-Economy Macroeconomics: Basic Concepts540 Questions
Exam 32: A Macroeconomic Theory of the Open Economy511 Questions
Exam 33: Aggregate Demand and Aggregate Supply572 Questions
Exam 34: The Influence of Monetary and Fiscal Policy on Aggregate Demand523 Questions
Exam 35: The Short-Run Tradeoff Between Inflation and Unemployment536 Questions
Exam 36: Six Debates Over Macroeconomic Policy354 Questions
Select questions type
Other things the same, if the central bank decreases the rate at which it increases the money supply, then
(Multiple Choice)
5.0/5  (25)
(25)
Just as the aggregate-demand curve slopes downward only in the short run, the trade-off between inflation and unemployment holds only in the long run.
(True/False)
5.0/5 (39)
Figure 35-4. The left-hand graph shows a short-run aggregate-supply (SRAS) curve and two aggregate-demand (AD) curves. On the left-hand diagram, the price level is measured on the vertical axis; on the right-hand diagram, the inflation rate is measured on the vertical axis. 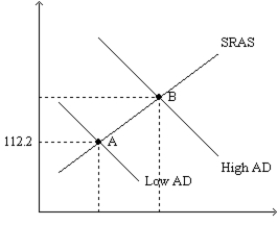
 -Refer to Figure 35-4. What is measured along the horizontal axis of the right-hand graph?
(Multiple Choice)
4.8/5 (38)
When aggregate demand shifts right along the short-run aggregate supply curve, unemployment
(Multiple Choice)
4.9/5 (44)
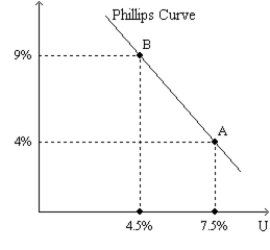
Figure 35-8
Use this graph to answer the questions below. 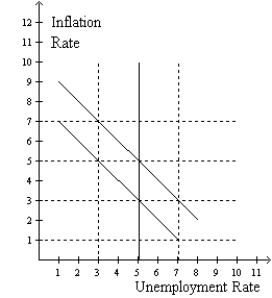 -Refer to figure 35-8. Suppose the economy starts at 5% unemployment and 3% inflation and expected inflation remains at 3%. Which one of the following points could the economy move to in the short run if the Federal Reserve pursues a more expansionary monetary policy?
(Multiple Choice)
4.8/5 (39)
Figure 35-1. The left-hand graph shows a short-run aggregate-supply (SRAS) curve and two aggregate-demand (AD) curves. On the right-hand diagram, U represents the unemployment rate. 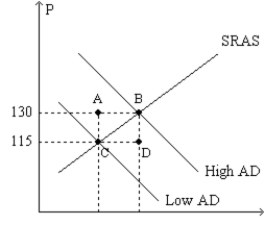
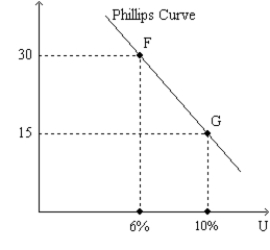 -Refer to Figure 35-1. Assuming the price level in the previous year was 100, point F on the right-hand graph corresponds to
(Multiple Choice)
4.7/5 (41)
The natural rate of unemployment is the same as the socially optimal rate of unemployment.
(True/False)
4.8/5 (33)
Figure 35-3. The left-hand graph shows a short-run aggregate-supply (SRAS) curve and two aggregate-demand (AD) curves. On the left-hand diagram, Y represents output and on the right-hand diagram, U represents the unemployment rate. 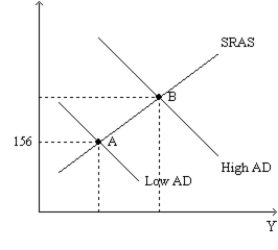
 -Refer to Figure 35-3. What is measured along the vertical axis of the left-hand graph?
(Multiple Choice)
4.8/5 (33)
An adverse supply shock shifts the short-run Phillips curve right and the short-run aggregate-supply curve left.
(True/False)
5.0/5 (39)
Suppose the Fed increased the growth rate of the money supply. Which of the following would be higher in the long run?
(Multiple Choice)
4.8/5 (35)
In 1968, economist Milton Friedman published a paper criticizing the Phillips curve on the grounds that
(Multiple Choice)
4.9/5 (27)
Samuelson and Solow reasoned that when aggregate demand was low, unemployment was
(Multiple Choice)
4.8/5 (37)
During the mid and last part of the 1990's both inflation and unemployment were low. In general this could have been the result of
(Multiple Choice)
4.9/5 (48)
Suppose the price level is 115.00 at the end of 2020, 112.02 at the end of 2021, and 109.08 at the end of 2022. Can we accurately describe the period 2021-2022 as a period of disinflation?
(Essay)
4.9/5 (35)
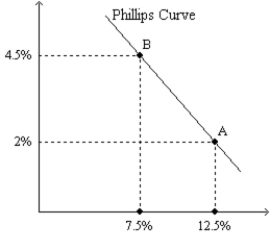
Figure 35-9. The left-hand graph shows a short-run aggregate-supply (SRAS) curve and two aggregate-demand (AD) curves. On the right-hand diagram, "Inf Rate" means "Inflation Rate." 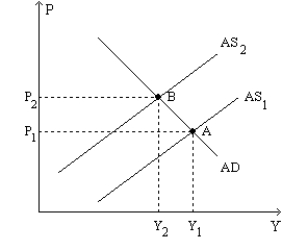
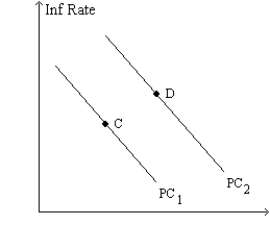 -Refer to Figure 35-9. What is measured along the horizontal axis of the right-hand graph?
(Multiple Choice)
4.9/5 (37)
When aggregate demand shifts rightward along the short-run aggregate-supply curve, inflation
(Multiple Choice)
5.0/5 (39)
Filters
- Essay(0)
- Multiple Choice(0)
- Short Answer(0)
- True False(0)
- Matching(0)