Exam 35: The Short-Run Tradeoff Between Inflation and Unemployment
Exam 1: Ten Principles of Economics455 Questions
Exam 2: Thinking Like an Economist643 Questions
Exam 3: Interdependence and the Gains From Trade547 Questions
Exam 4: The Market Forces of Supply and Demand693 Questions
Exam 5: Elasticity and Its Application626 Questions
Exam 6: Supply, Demand, and Government Policies668 Questions
Exam 7: Consumers, Producers, and the Efficiency of Markets547 Questions
Exam 8: Applications: the Costs of Taxation509 Questions
Exam 9: Application: International Trade521 Questions
Exam 10: Externalities543 Questions
Exam 11: Public Goods and Common Resources452 Questions
Exam 12: The Design of the Tax System664 Questions
Exam 13: The Costs of Production649 Questions
Exam 14: Firms in Competitive Markets604 Questions
Exam 15: Monopoly662 Questions
Exam 16: Monopolistic Competition649 Questions
Exam 17: Oligopoly522 Questions
Exam 18: The Markets for the Factors of Production592 Questions
Exam 19: Earnings and Discrimination511 Questions
Exam 20: Income Inequality and Poverty478 Questions
Exam 21: The Theory of Consumer Choice570 Questions
Exam 22: Frontiers in Microeconomics461 Questions
Exam 23: Measuring a Nation S Income547 Questions
Exam 24: Measuring the Cost of Living565 Questions
Exam 25: Production and Growth527 Questions
Exam 26: Saving, Investment, and the Financial System637 Questions
Exam 27: Tools of Finance534 Questions
Exam 28: Unemployment and Its Natural Rate701 Questions
Exam 29: The Monetary System540 Questions
Exam 30: Money Growth and Inflation504 Questions
Exam 31: Open-Economy Macroeconomics: Basic Concepts540 Questions
Exam 32: A Macroeconomic Theory of the Open Economy511 Questions
Exam 33: Aggregate Demand and Aggregate Supply572 Questions
Exam 34: The Influence of Monetary and Fiscal Policy on Aggregate Demand523 Questions
Exam 35: The Short-Run Tradeoff Between Inflation and Unemployment536 Questions
Exam 36: Six Debates Over Macroeconomic Policy354 Questions
Select questions type
As the aggregate demand curve shifts rightward along a given aggregate supply curve,
(Multiple Choice)
4.9/5  (28)
(28)
What would a central bank need to do to reverse the effects of a favorable supply shock on inflation? What would its reaction do to the unemployment rate in the short run?
(Essay)
4.8/5 (33)
According to the long-run Phillips curve, in the long run monetary policy influences
(Multiple Choice)
4.8/5 (45)
Are the effects of an increase in aggregate demand in the aggregate demand and aggregate supply model consistent with the Phillips curve? Explain.
(Essay)
4.7/5 (40)
A basis for the slope of the short-run Phillips curve is that when unemployment is high there are
(Multiple Choice)
4.8/5 (40)
Samuelson and Solow argued that a combination of low unemployment and low inflation
(Multiple Choice)
4.8/5 (38)
Figure 35-7
Use the two graphs in the diagram to answer the following questions. 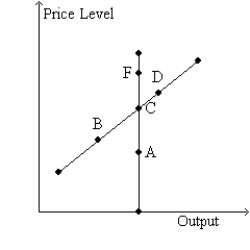
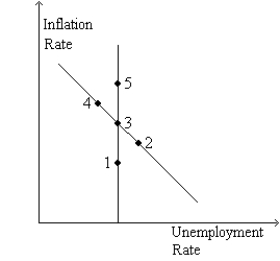 -Refer to Figure 35-7. Starting from C and 3, in the long run, a decrease in money supply growth moves the economy to
(Multiple Choice)
4.9/5 (38)
Which of the following results in higher inflation and higher unemployment in the short run?
(Multiple Choice)
4.9/5 (35)
In most of the 1970s, the Fed's policy created expectations of high inflation.
(True/False)
4.9/5 (30)
In the long run, which of the following depends primarily on the growth rate of the money supply?
(Multiple Choice)
4.7/5 (45)
If monetary policy moves unemployment below its natural rate, both expected and actual inflation will rise.
(True/False)
4.9/5 (43)
Assume the natural rate of unemployment is 6%. Draw the short-run and long-run Phillips curves and show the position of the economy if expected inflation is 3% and the actual inflation rate is 2%.
(Essay)
4.8/5 (39)
If inflation expectations rise, the short-run Phillips curve shifts
(Multiple Choice)
4.9/5 (35)
Figure 35-8
Use this graph to answer the questions below. 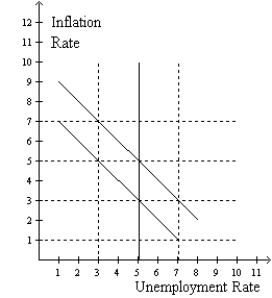 -Refer to figure 35-8. Suppose the economy starts at 5% unemployment and 3% inflation. If the Federal Reserve pursues an expansionary monetary policy, in the short run the economy moves to
(Multiple Choice)
4.9/5 (39)
Figure 35-2
Use the pair of diagrams below to answer the following questions. 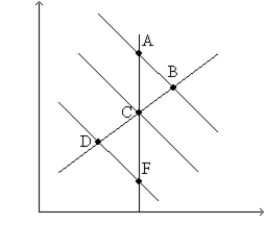
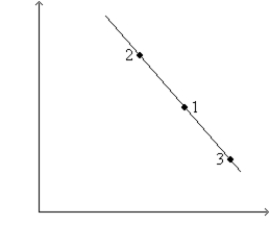 -Refer to Figure 35-2. If the economy starts at C and 1, then in the short run, a decrease in the money supply moves the economy to
(Multiple Choice)
4.7/5 (40)
If expected inflation increases, the short-run Phillips curve will shift to the left so that inflation will be higher at any given unemployment rate.
(True/False)
4.9/5 (36)
Figure 35-9. The left-hand graph shows a short-run aggregate-supply (SRAS) curve and two aggregate-demand (AD) curves. On the right-hand diagram, "Inf Rate" means "Inflation Rate." 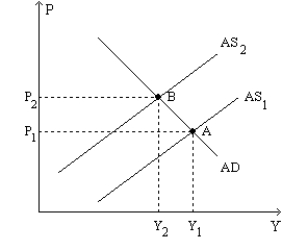
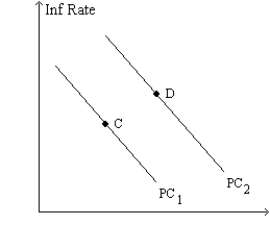 -Refer to Figure 35-9. The shift of the aggregate-supply curve from AS1 to AS2
(Multiple Choice)
4.7/5 (36)
If the Federal Reserve accommodates an adverse supply shock,
(Multiple Choice)
4.7/5 (35)
An adverse supply shock shifts the short-run Phillips curve to the
(Multiple Choice)
4.8/5 (38)
Filters
- Essay(0)
- Multiple Choice(0)
- Short Answer(0)
- True False(0)
- Matching(0)