Exam 34: The Influence of Monetary and Fiscal Policy on Aggregate Demand
Exam 1: Ten Principles of Economics220 Questions
Exam 2: Thinking Like an Economist284 Questions
Exam 3: Interdependence and the Gains From Trade192 Questions
Exam 4: The Market Forces of Supply and Demand277 Questions
Exam 5: Elasticity and Its Application222 Questions
Exam 6: Supply, Demand, and Government Policies321 Questions
Exam 7: Consumers, Producers, and the Efficiency of Markets218 Questions
Exam 8: Applications: The Costs of Taxation203 Questions
Exam 9: Application: International Trade214 Questions
Exam 10: Externalities204 Questions
Exam 11: Public Goods and Common Resources182 Questions
Exam 12: The Design of the Tax System225 Questions
Exam 13: The Costs of Production261 Questions
Exam 14: Firms in Competitive Markets243 Questions
Exam 15: Monopoly231 Questions
Exam 16: Monopolistic Competition246 Questions
Exam 17: Oligopoly204 Questions
Exam 18: The Markets for the Factors of Production232 Questions
Exam 19: Earnings and Discrimination230 Questions
Exam 20: Income Inequality and Poverty194 Questions
Exam 21: The Theory of Consumer Choice209 Questions
Exam 22: Frontiers in Microeconomics185 Questions
Exam 23: Measuring a Nations Income231 Questions
Exam 24: Measuring the Cost of Living214 Questions
Exam 25: Production and Growth187 Questions
Exam 26: Saving, Investment, and the Financial System225 Questions
Exam 27: Tools of Finance198 Questions
Exam 28: Unemployment and Its Natural Rate361 Questions
Exam 29: The Monetary System210 Questions
Exam 30: Money Growth and Inflation201 Questions
Exam 31: Open-Economy Macroeconomics: Basic Concepts194 Questions
Exam 32: A Macroeconomic Theory of the Open Economy188 Questions
Exam 33: Aggregate Demand and Aggregate Supply189 Questions
Exam 34: The Influence of Monetary and Fiscal Policy on Aggregate Demand207 Questions
Exam 35: The Short-Run Tradeoff Between Inflation and Unemployment223 Questions
Exam 36: Six Debates Over Macroeconomic Policy154 Questions
Select questions type
Figure 34-7
(a) The Money Market
(b) The Aggregate Demand Curve 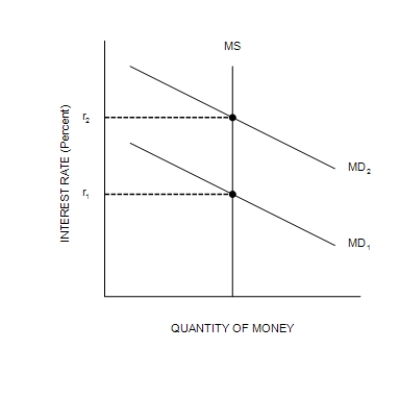
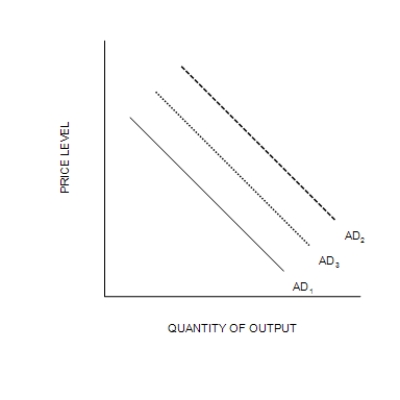 -Refer to Figure 34-7. Suppose the multiplier is 5 and the government increases its purchases by $15 billion. Also, suppose the AD curve would shift from AD1 to AD2 if there were no crowding out; the AD curve actually shifts from AD1 to AD3 with crowding out. Also, suppose the horizontal distance between the curves AD1 and AD3 is $55 billion. The extent of crowding out, for any particular level of the price level, is
(Multiple Choice)
4.9/5  (43)
(43)
Figure 34-4 
-Refer to Figure 34-4. Which of the following events could explain a shift of the money-demand curve from MD1 to MD2?
-Refer to Figure 34-4. Which of the following events could explain a shift of the money-demand curve from MD1 to MD2?
(Multiple Choice)
4.7/5 (30)
It is likely that a constitutional amendment that required the government always to run a balanced budget would
(Multiple Choice)
4.8/5 (38)
A decrease in taxes will shift aggregate demand to the _____, cause consumption to _____, and cause output to _____. Due to the crowding-out effect, investment will _____.
(Short Answer)
4.8/5 (43)
The wealth effect along an aggregate-demand curve stems from the idea that a higher price level
(Multiple Choice)
4.9/5 (37)
When the Fed announces a target for the federal funds rate, it essentially accommodates the day-to-day fluctuations in money demand by adjusting the money supply accordingly.
(True/False)
5.0/5 (40)
If the Federal Reserve's goal is to stabilize aggregate demand, then it will _____ the money supply in response to a stock market boom. This causes interest rates to _____.
(Short Answer)
4.9/5 (39)
The Fed can influence the money supply by changing the interest rate it pays banks on the reserves they are holding.
(True/False)
4.9/5 (40)
Which of the following correctly explains the crowding-out effect?
(Multiple Choice)
4.9/5 (39)
An increase in the price level shifts the money demand curve to the left, causing interest rates to increase.
(True/False)
4.8/5 (31)
Explain why the interest rate is the opportunity cost of holding currency. What is the benefit of holding currency?
(Essay)
4.8/5 (42)
Figure 34-2
(a) The Money Market
(b) The Aggregate Demand Curve 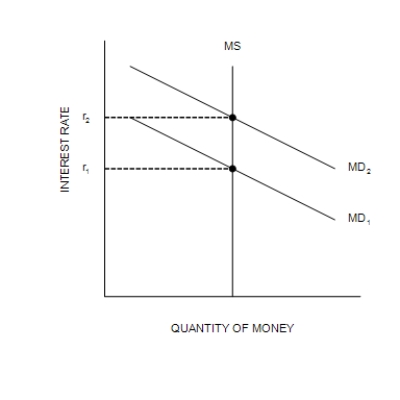
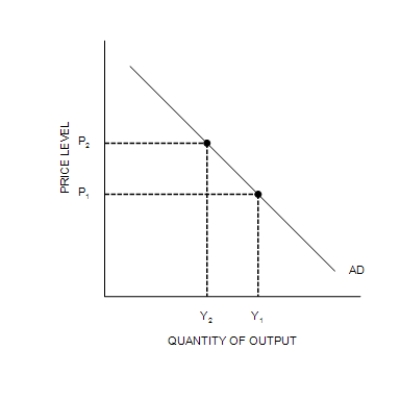 -Refer to Figure 34-2. If the money-supply curve MS on the left-hand graph were to shift to the left, this would
(Multiple Choice)
4.8/5 (33)
Economists who are skeptical about the relevance of "liquidity traps" argue that
(Multiple Choice)
4.7/5 (43)
If the Federal Reserve decided to raise interest rates, it could
(Multiple Choice)
4.9/5 (34)
The government builds a new water-treatment plant. The owner of the company that builds the plant pays her workers. The workers increase their spending. Firms from which the workers buy goods increase their output. This type of effect on spending illustrates
(Multiple Choice)
4.8/5 (42)
A significant lag for monetary policy is the time it takes to for a change in the money supply to change the economy. A significant lag for fiscal policy is the time it takes to pass legislation authorizing it.
(True/False)
4.7/5 (45)
Use the money market to explain the interest-rate effect and its relation to the slope of the aggregate demand curve.
(Essay)
4.9/5 (37)
Filters
- Essay(0)
- Multiple Choice(0)
- Short Answer(0)
- True False(0)
- Matching(0)