Exam 12: Statistical Analysis Questions in ANOVA and Rank-Sum Test
Exam 1: Basic Ideas32 Questions
Exam 2: Graphical Summaries of Data34 Questions
Exam 3: Numerical Summaries of Data62 Questions
Exam 4: Probability30 Questions
Exam 5: Discrete Probability Distributions83 Questions
Exam 6: The Normal Distribution52 Questions
Exam 7: Confidence Intervals65 Questions
Exam 8: Hypothesis Testing46 Questions
Exam 9: Inferences on Two Samples86 Questions
Exam 10: Tests With Qualitative Data33 Questions
Exam 11: Correlation and Regression39 Questions
Exam 12: Statistical Analysis Questions in ANOVA and Rank-Sum Test140 Questions
Select questions type
In a study of reaction times, the time to respond to a visual stimulus (x)and the
(Essay)
4.8/5  (32)
(32)
The following display from a TI-84 Plus calculator presents the results of a test of the null hypothesis .
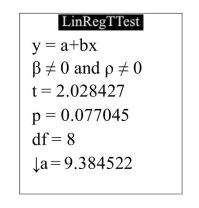 What is the P-value?
(Multiple Choice)
4.8/5 (41)
Monthly rents were recorded for a sample of 36 apartments in a certain city. The results were as follows.
1180 1240 1170 1280 1040 980 1420 1150 1060 990 1010 1260 1350 1130 1370 1130 990 1080 1220 1420 1130 1050 1130 1090 1030 1260 1030 1170 1050 1320 1450 1000 1090 1450 1120 1120
Can you conclude that the median rent is less than per month? Use the level of significance.
a. State appropriate null and alternate hypotheses.
b. Compute the test statistic.
c. Find the critical value.
d. State a conclusion. were as follows.
(Essay)
4.8/5 (33)
Artificial hip joints consist of a ball and socket. As the joint wears, the ball (head) becomes rough. Investigators performed wear tests on metal, artificial hip joints. Joints with several different diameters were tested. The following table presents measurements of head roughness (in nanometers).
Diameter Head Roughness 16 20.9 20.0 31.4 24.8 24 32.6 28.0 36.5 30 19.0 19.3 29.8
i). Construct an ANOVA table.
ii). Can you conclude that the mean roughness varies with diameter? Use the level of significance.
(Essay)
4.9/5 (45)
The following data was collected as part of a study examining whether there is a difference between the number of hours men and women watch television. The values represent the number of hours a subject watched television on a designated Tuesday night. In the process of computing the test value the data from both samples should be combined, arranged in order, and ranked according to each group. Calculate the sum of the ranks for both groups. Lower values rank ahead of higher ones
Men 2.0 1.5 3.0 2.5 2.0 1.0 0.0 2.0 1.5 2.5 2.0 2.0 Women 2.0 2.5 1.0 1.0 1.5 2.5 2.0 1.0 2.0 1.5 1.0 0.0
(Multiple Choice)
4.7/5 (32)
What is the critical value? The summary statistics for a certain set of points are: , , and . Assume the conditions of the linear model hold. A confidence interval for will be constructed.
(Multiple Choice)
4.9/5 (32)
In a water-bottling facility, several machines fill plastic bottles with 16 ounces of drinking water. The following TI-84 Plus display presents the results of a one-way ANOVA to determine whether the mean fill volumes differ among the filling machines
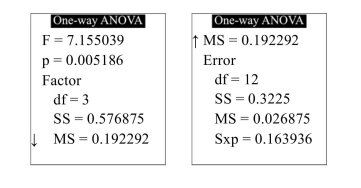 Can you conclude that the mean fill volume differs among the filling machines? Use the level of significance.
(True/False)
4.8/5 (38)
Artificial hip joints consist of a ball and socket. As the joint wears, the ball (head) becomes rough. Investigators performed wear tests on metal artificial; hip joints. Joints with several different diameters were tested. The following table presents measurements of head roughness (in nanometers).
Diameter Head Roughness 16 19.8 25.9 17.5 23.2 24 31.9 33.0 27.7 30 26.6 28.8 21.2
Perform the Tukey-Kramer test to determine which pairs of means, if any, differ. Use the level of significance.
(Multiple Choice)
4.8/5 (35)
Following is a set of observed and expected frequencies: ) Observed 5 18 26 23 16 Expected 10 15 30 15 10
Test the hypothesis that the distribution of the observed frequencies is as given by the expected frequencies. Use the level of significance.
(Multiple Choice)
4.8/5 (35)
Samples were drawn from three populations. The sample sizes were and The sample means were The sample standard deviations were The grand mean is
How many degrees of freedom are there for SSTr.
(Multiple Choice)
4.8/5 (37)
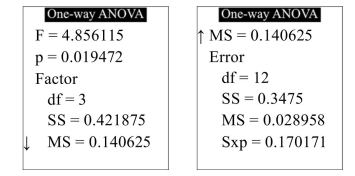
An experiment is conducted to study the effects of curing times and curing temperatures on the bonding strength of an epoxy adhesive. In the experiment, two steel rods are adhered together end-to-end, and the bonding strength is defined as the force, in pounds, required to pull the bond apart. For each combination of curing time and curing temperature, three tests are performed. The results of the experiment are shown below.
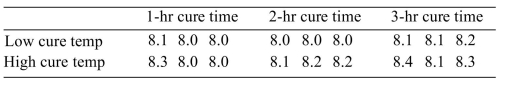 Can the main effect of curing temperature (low or high) on bonding strength be interprete interpret the main effect using the level of significance.
(Multiple Choice)
4.9/5 (30)
In a study of reaction times,) Visual Auditory 208 249 200 244 245 254 234 249 155 243 211 248 189 244 206 247
Test versus . Use the level of significance.
(Multiple Choice)
4.7/5 (43)
A psychology instructor gave a five-question true-false quiz to her class of 171
(Essay)
4.8/5 (32)
Samples were drawn from three populations. The sample sizes were and The sample means were The sample standard deviations were
The grand mean is
Compute the mean squares MSE.
(Multiple Choice)
4.9/5 (31)
The following table shows the weekly total sales (in dollars) at a small roadside vegetable stand for the months June through September
Month Weekly Sales June 980 1096 1103 869 July 1061 1042 929 1014 August 1060 1176 1447 1130 September 1018 872 986 1103
Can you conclude that the weekly sales varies with the month? Use the level of significance.
(True/False)
4.7/5 (30)
The sign test is performed to test
There are 17 positive signs and 21 negative signs in a test involving 38 samples. What is the value of the test statistic?
(Multiple Choice)
4.9/5 (31)
Fill in the blank with the appropriate word or phrase. The null hypothesis for the rank-sum test is that the two population ? are equal
(Multiple Choice)
4.8/5 (38)
In a water-bottling facility, several machines fill plastic bottles with 16 ounces of
drinking water. The following TI-84 Plus display presents the results of a one-way ANOVA to determine whether the mean fill volumes differ among the filling machines
 What is the value of MSE?
(Multiple Choice)
4.9/5 (39)
The following MINITAB output presents a multiple regression equation
The regression equation is
Predictor Coef SE Coef T P Constant 5.3535 0.7240 0.8771 0.338 X1 0.7929 0.7986 3.3073 0.002 X2 -0.8918 0.8208 -2.9354 0.009 X3 0.5297 0.8980 1.9458 0.083 X4 -1.7948 0.6461 -1.0262 0.340
Analysis of Variance Source DF SS MS F P Regression 4 1188.8 297.2 7.7396 0.003 Residual Error 31 1190.1 38.4 Total 35 2378.9
What percentage of the variation in y is explained by the model?
(Multiple Choice)
4.9/5 (33)
Filters
- Essay(0)
- Multiple Choice(0)
- Short Answer(0)
- True False(0)
- Matching(0)