Exam 12: Statistical Analysis Questions in ANOVA and Rank-Sum Test
Exam 1: Basic Ideas32 Questions
Exam 2: Graphical Summaries of Data34 Questions
Exam 3: Numerical Summaries of Data62 Questions
Exam 4: Probability30 Questions
Exam 5: Discrete Probability Distributions83 Questions
Exam 6: The Normal Distribution52 Questions
Exam 7: Confidence Intervals65 Questions
Exam 8: Hypothesis Testing46 Questions
Exam 9: Inferences on Two Samples86 Questions
Exam 10: Tests With Qualitative Data33 Questions
Exam 11: Correlation and Regression39 Questions
Exam 12: Statistical Analysis Questions in ANOVA and Rank-Sum Test140 Questions
Select questions type
In a study of reaction times,) Visual Auditory 193 189 240 222 239 226 236 225 200 189 161 158 214 209 204 193
Construct a confidence interval for the slope of the least-squares regression line.
(Multiple Choice)
4.7/5  (36)
(36)
A biology professor claims that, on the average, 15% of her students get a grade
(Essay)
4.9/5 (41)
Six second-graders tried tossing a ball into a basket ten times each. Their teacher then suggested a different way of tossing the ball, and the six students tried again. The number of successful tosses, before and after the teacher's suggestion, are shown below.
Student Before the suggestion (out of 10) 4 4 6 4 6 4 After the suggestion (out of 10) 6 4 3 6 3 4
Compute , the test statistic for a signed-rank test.
(Multiple Choice)
4.9/5 (31)
A wild life biologist believes that the median length of the fish in a lake is 3 5 cm. A random sample of 14 fish yields the following lengths.
20 20 22 24 24 26 27 29 30 32 35 37 41 43
Test the biologist's hypothesis at .
(Multiple Choice)
4.9/5 (34)
The summary statistics for a certain set of points are: n=13 ,
Assume the conditions of the linear model hold A
99% confidence interval for will be constructed.
Test the null hypothesis
Use the level of significance.
(Multiple Choice)
4.9/5 (32)
For the following data, compute the test statistic and the critical value, and determine whether to reject at the level.
Sample A 240 255 240 240 248 241 246 241 Sample B 230 241 228 234 231 233 243 227
(Multiple Choice)
4.9/5 (37)
Use the given set of points to construct a 95 % prediction interval for an individual response for the given value of x .
x 13 19 19 15 10 18 y 59 84 80 69 46 78 xequals17
(Multiple Choice)
4.9/5 (35)
An agricultural scientist performs a 2-way ANOVA to determine the effects of three different soil mixtures on the sprouting time (in days) of three varieties of hybrid cucumber seeds. The following MINITAB output presents the results
Analysis of Variance for Sprouting Source DF SS MS F P Soil Mixture 2 24.074074 12.037037 5.909091 0.010644 Hybrid Variety 2 5.851852 2.925926 1.436364 0.263779 Interaction 4 20.37037 5.092593 2.5 0.079023 Error 18 36.666667 2.037037 Total 26 86.962963 Can you reject the hypothesis of no interactions?
(True/False)
4.9/5 (40)
The following MINITAB output presents a 95% confidence interval for the mean ozone Predicted Values for New Observations
New Obs Fit SE Fit 95.0\% CI 95.0\% PI 1 37.26 1.3 (34.71,39.81) (24.41,50.11)
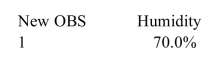
Values of Predictors for New Observations
New OBS Humidity 1 40.0\%
What is the confidence interval for the mean ozone level for days when the relative humidity is ?
(Multiple Choice)
4.7/5 (37)
For the following observed and expected frequencies, compute the value of
Observed 8 12 29 7 18 Expected 10 15 30 15 15
(Multiple Choice)
4.8/5 (34)
The following MINITAB output presents a multiple regression equation
The regression equation is
Predictor Coef SE Coef T P Constant 3.9695 0.8785 0.9299 0.327 X1 1.4577 0.6034 3.5107 0.003 X2 -1.7859 0.7302 -3.1148 0.005 X3 0.7686 0.6732 1.9294 0.088 X4 0.0777 0.7569 -1.0782 0.352
Analysis of Variance Source DF SS MS F P Regression 4 1148.7 287.2 9.0031 0.003 Residual Error 34 1083.9 31.9 Total 38 2232.6
Is the model useful for prediction? Use the level.
(Multiple Choice)
4.8/5 (42)
Use the given set of points to compute the margin of error for a 95% confidence interval for
x 11 8 5 9 14 5 10 11 y 30 17 22 23 34 9 28 30
(Multiple Choice)
4.9/5 (45)
Use the given set of points to compute
x 6 11 14 7 5 8 14 12 y 20 25 36 19 13 23 29 28
(Multiple Choice)
4.8/5 (47)
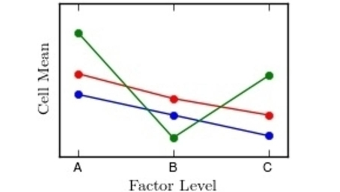
Interpret the interaction plot by explaining whether there appear to be large interactions between factors.
(Multiple Choice)
4.8/5 (27)
The following table shows the weekly total sales (in dollars) at a small roadside vegetable stand for the months June through September
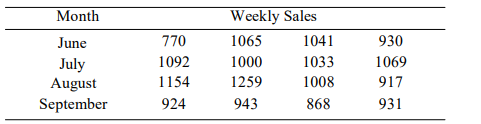 i). Construct an ANOVA table.
ii). Can you conclude that the weekly sales varies with the month? Use the Į = 0.05 level of significance.
i). Construct an ANOVA table.
ii). Can you conclude that the weekly sales varies with the month? Use the Į = 0.05 level of significance.
(Essay)
4.7/5 (39)
In a study of reaction times,) The regression equation is
Auditory Visual
Predictor Coef SE Coef T P Constant 240.686515 14.271226 16.865161 0.000073 Visual 0.109829 0.066275 1.657159 0.172829 What is the intercept of the least-squares regression line?
(Multiple Choice)
5.0/5 (32)
The following MINITAB output presents a 95% confidence interval for the mean ozone Predicted Values for New Observations
New Obs Fit SE Fit 95.0\% 95.0\% 1 36.83 1.8 (33.30,40.36) (20.06,53.60)
Values of Predictors for New Observations
 Predict the ozone level for a day when the relative humidity is .
(Multiple Choice)
4.8/5 (37)
An experiment is conducted to study the effects of curing times and curing temperatures on the bonding strength of an epoxy adhesive. In the experiment, two steel rods are adhered together end-to-end, and the bonding strength is defined as the force, in pounds, required to pull the bond apart. For each combination of curing time and curing temperature, three tests are performed. The results of the experiment are shown below
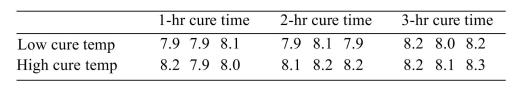 Can the main effect of curing time on bonding strength be interpreted? If so, interpret the main effect. using the level of significance.
(Multiple Choice)
4.9/5 (40)
How many degrees of freedom are there for the critical value? The summary statistics for a certain set of points are: ,
, and . Assume the conditions of the linear model hold. A confidence interval for will be constructed.
(Multiple Choice)
4.7/5 (48)
Following are observed frequencies. The null hypothesis is
Category 1 2 3 4 5 Observed 33 13 7 12 8
Compute the expected frequencies.
(Multiple Choice)
4.8/5 (36)
Filters
- Essay(0)
- Multiple Choice(0)
- Short Answer(0)
- True False(0)
- Matching(0)