Exam 12: Statistical Analysis Questions in ANOVA and Rank-Sum Test
Exam 1: Basic Ideas32 Questions
Exam 2: Graphical Summaries of Data34 Questions
Exam 3: Numerical Summaries of Data62 Questions
Exam 4: Probability30 Questions
Exam 5: Discrete Probability Distributions83 Questions
Exam 6: The Normal Distribution52 Questions
Exam 7: Confidence Intervals65 Questions
Exam 8: Hypothesis Testing46 Questions
Exam 9: Inferences on Two Samples86 Questions
Exam 10: Tests With Qualitative Data33 Questions
Exam 11: Correlation and Regression39 Questions
Exam 12: Statistical Analysis Questions in ANOVA and Rank-Sum Test140 Questions
Select questions type
Use the given set of points to compute the residual standard deviation
x 13 10 10 11 13 7 11 6 y 32 26 23 24 28 16 26 21
(Multiple Choice)
4.9/5  (28)
(28)
Use the given set of points to construct a 95 % confidence interval for the mean response for the given value of x
x 20 13 12 10 11 10 y 108 69 63 55 58 53 xequals12
(Multiple Choice)
4.9/5 (37)
In a study of reaction times,) The regression equation is
Auditory Visual
Predictor Coef SE Coef T P Constant 181.501124 21.861296 8.302395 0.00115 Visual 0.408378 0.113544 3.596642 0.022827
What is the slope of the least-squares regression line?
(Multiple Choice)
5.0/5 (43)
A biology professor claims that,) Grade 1 2 3 4 5 Observed 26 34 50 4 13
Compute the expected frequencies.
(Multiple Choice)
4.7/5 (31)
The following data was collected as part of a study examining whether there is a difference between the number of hours men and women watch television. The values represent the number of hours a subject watched television on a designated Tuesday night. Lower values rank ahead of higher ones.
Men 2.0 1.5 3.0 2.5 2.0 1.0 0.0 2.0 1.5 2.5 2.0 2.0 Women 2.0 2.5 1.0 1.0 1.5 2.5 2.0 1.0 2.0 1.5 1.0 0.0
a) Calculate the -value.
b) Can you conclude that the median times watching television are different? Use the level of significance.
(Multiple Choice)
4.9/5 (33)
Construct the multiple regression sequence for the following data set:
y 31.3 50 19 4.0 56.9 90 38 8.0 43.1 70 28 6.5 41.5 70 25 5.5 39.0 60 26 6.5 40.9 70 29 5.0 35.9 60 23 5.5 43.5 70 28 5.5 47.9 80 34 6.5 33.8 70 26 4.5
(Multiple Choice)
4.8/5 (36)
Samples were drawn from three populations. The sample sizes were and The sample means were The sample standard deviations were The grand mean is
How many degrees of freedom are there for SSE.
(Multiple Choice)
4.8/5 (45)
For the following data, compute the test statistic and the critical value, and determine whether to reject at the level.
Sample A 42 55 59 57 49 60 43 54 Sample B 28 44 42 64 61 46 39 63
(Multiple Choice)
4.8/5 (40)
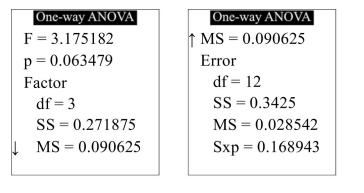
In a water-bottling facility, several machines fill plastic bottles with 16 ounces of drinking water. The following TI-84 Plus display presents the results of a one-way ANOVA to determine whether the mean fill volumes differ among the filling machines
 What is the -value?
(Multiple Choice)
4.8/5 (42)
The following MINITAB output presents a 99% confidence interval for the mean ozone Predicted Values for New Observations
New Obs Fit SE Fit 99.0\% CI 99.0\% PI 1 35.73 1.3 (32.38,39.08) (19.47,51.99)
Values of Predictors for New Observations
New OBS Humidity 1 65.0\%
What is the point estimate for the mean ozone level for days when the relative humidity is ?
(Multiple Choice)
4.9/5 (26)
Find the critical value for the chi-square statistic with 14 degrees of freedom.
(Multiple Choice)
4.8/5 (37)
A sample of 149 university students who recently moved off-campus were polled to see whether 1 2 3 Agree 25 17 34 No Opinion 8 12 15 Disagree 11 18 6
Perform a test for independence, using the level of significance. What do you conclude?
(Multiple Choice)
4.7/5 (39)
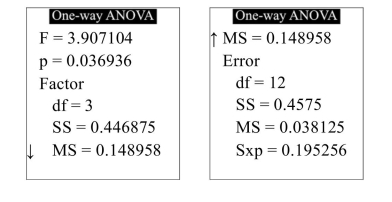
In a water-bottling facility, several machines fill plastic bottles with 16 ounces of drinking water. The following TI-84 Plus display presents the results of a one-way ANOVA to determine whether the mean fill volumes differ among the filling machines.
 What is the value of MSTr?
(Multiple Choice)
4.7/5 (39)
Use the given set of points to compute the predicted value for the given value of x .
x 13 14 16 13 13 16 y 61 66 75 60 64 72
x=12
(Multiple Choice)
4.8/5 (29)
The following table presents measurements of the tensile strength (in kilopascals) of asphalt-rubber concrete beams for three levels of binder content and three levels of rubber content.
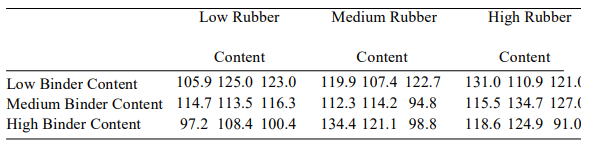 Can the mean effect of the rubber content be interpreted? If so, interpret the main effect. I level of significance.
(Multiple Choice)
5.0/5 (30)
The number of visits to a certain web site were counted each day of a particular week.
(Essay)
4.8/5 (39)
The following MINITAB output presents a multiple regression equation
The regression equation is
Predictor Coef SE Coef T P Constant 2.5919 0.6269 1.1668 0.337 X1 -1.3391 0.6716 3.5190 0.002 X2 0.6212 0.8488 -3.2848 0.004 X3 1.6435 0.7934 1.8821 0.090 X4 1.4269 0.7679 -0.9879 0.345
Analysis of Variance Source DF SS MS F P Regression 4 735.9 184.0 7.7311 0.003 Residual Error 25 594.6 23.8 Total 29 1330.5
Let be the coefficient Test the hypothesis versus at the What do you conclude?
(Multiple Choice)
4.9/5 (38)
Use the given set of points to compute the standard error of
x 7 7 10 8 14 8 5 9 y 16 18 21 16 33 19 17 23
(Multiple Choice)
4.9/5 (35)
Following are observed frequencies. The null hypothesis is
Category 1 2 3 4 5 Observed 49 34 14 9 10
Test the hypothesis that the distribution of the observed frequencies is as given by the nul hypothesis. Use the level of significance.
(Multiple Choice)
4.8/5 (41)
In a study of reaction times,) Visual Auditory 185 244 204 244 242 247 209 245 191 243 250 249 155 237 188 245 Compute a point estimate for the mean auditory response time for subjects with a visual response time of 231.
(Multiple Choice)
4.8/5 (38)
Filters
- Essay(0)
- Multiple Choice(0)
- Short Answer(0)
- True False(0)
- Matching(0)