Exam 10: Correlation and Regression
Exam 1: Introduction to Statistics59 Questions
Exam 2: Exploring Data With Tables and Graphs59 Questions
Exam 3: Describing, Exploring, and Comparing Data59 Questions
Exam 4: Probability60 Questions
Exam 5: Discrete Probability Distributions59 Questions
Exam 6: Normal Probability Distributions60 Questions
Exam 7: Estimating Parameters and Determining Sample Sizes58 Questions
Exam 8: Hypothesis Testing57 Questions
Exam 9: Inferences From Two Samples58 Questions
Exam 10: Correlation and Regression56 Questions
Exam 11: Chi-Square and Analysis of Variance60 Questions
Exam 12: Statistical Control Charts, Nonparametric Tests, and Hypothesis Testing181 Questions
Select questions type
A 0.05 significance level is being used to test a correlation between two variables. If the linear correlation coefficient r is found to be 0.591 and the critical values are what can you conclude?
(Multiple Choice)
4.9/5  (36)
(36)
Find the value of the linear correlation coefficient r. The paired data below consist of the_ temperatures on randomly chosen days and the amount a certain kind of plant grew (in
Millimeters). Temperature 62 76 50 51 71 46 51 44 79 Growth 36 39 50 13 33 33 17 6 16
A) 0
В)
C)
D)
(Short Answer)
4.7/5 (38)
Below are the productivity, dexterity, and job satisfaction ratings of ten randomly selected_ employees. Productivity ( ) 23 25 28 21 21 25 26 30 34 36 Dexterity ( ) 43 53 59 42 47 53 55 63 67 75 Satisfaction ( ) 56 58 60 50 54 61 59 63 67 69
Find the multiple regression equation that expresses the job satisfaction scores in terms of the productivity and dexterity scores.
(Multiple Choice)
4.9/5 (35)
Given the linear correlation coefficient r and the sample size n, determine the critical values of r_ and use your finding to state whether or not the given r represents a significant linear
Correlation. Use a significance level of 0.05.
(Multiple Choice)
4.8/5 (33)
Find the unexplained variation for the paired data. The equation of the regression line for the paired data below is
2 4 5 6 7 11 13 20
(Multiple Choice)
4.7/5 (35)
Suppose there is significant correlation between two variables. Describe two cases under_
which it might be inappropriate to use the linear regression equation for prediction. Give
examples to support these cases.
(Essay)
4.8/5 (37)
Describe the standard error of estimate, se. How do smaller values of se relate to the_
dispersion of data points about the line determined by the linear regression equation? What
does it mean when se is 0?
(Essay)
4.9/5 (30)
Which of the following statements concerning the linear correlation coefficient are true?_ I: If the linear correlation coefficient for two variables is zero, then there is no relationship
Between the variables.
II: If the slope of the regression line is negative, then the linear correlation coefficient is
Negative.
III: The value of the linear correlation coefficient always lies between −1 and 1.
IV: A linear correlation coefficient of 0.62 suggests a stronger linear relationship than a linear
Correlation coefficient of -0.82.
(Multiple Choice)
4.8/5 (39)
A set of data consists of the number of years that applicants for foreign service jobs have_
studied German and the grades that they received on a proficiency test. The following
regression equation is obtained: , where x represents the number of years of
study and y represents the grade on the test. Identify the predictor and response variables.
(Essay)
4.9/5 (40)
Suppose you will perform a test to determine whether there is sufficient evidence to support a claim of a linear correlation between two variables. Find the critical value(s) of r given that n=15 and
(Multiple Choice)
5.0/5 (33)
Use the given data to find the best predicted value of the response variable. Ten pairs of data yield r=0.003 and the regression equation
What is the best predicted value of y for x=2 ?
(Multiple Choice)
4.7/5 (33)
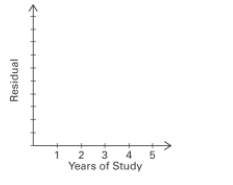
Applicants for a particular job, which involves extensive travel in Spanish speaking_
countries must take a proficiency test in Spanish. The sample data below were obtained in a
study of the relationship between the numbers of years applicants have studied Spanish (x)
and their score on the test (y). x 3 4 4 2 5 3 4 5 3 2 y 57 78 72 58 89 63 73 84 75 48
The regression equation was obtained. Construct a residual plot for the data.
(Essay)
4.9/5 (34)
The table below lists weights (carats)and prices (dollars)for randomly selected diamonds. Is
there sufficient evidence to suggest that there is a linear correlation between weights and
prices? Construct a scatterplot, and find the value of the linear correlation coefficient r.
Also find the P-value or the critical values of r using Weight 0.3 0.4 0.5 0.5 1.0 0.7 Price 510 1151 1343 1410 5669 2277
(Essay)
4.8/5 (32)
A 0.01 significance level is being used to test a correlation between two variables. If the linear correlation coefficient r is found to be 0.591 and the critical values are what can you conclude?
(Multiple Choice)
4.9/5 (31)
A quadratic regression model is fit to a set of sample data consisting of 6 pairs of data. Given that the sum of squares of residuals is 29.73 and that the y-values are 11, 14, 19, 22, 26, 27,
Find
(Multiple Choice)
4.9/5 (41)
Find the indicated multiple regression equation. Below are performance and attitude ratings of_ employees. Performance 59 63 65 69 58 77 76 69 70 64 Attitude 72 67 78 82 75 87 92 83 87 78 Managers also rate the same employees according to adaptability, and below are the results that
Correspond to those given above.
Adaptability : 50 52 54 60 46 67 66 59 62 55 Find the multiple regression equation that expresses performance in terms of attitude and
Adaptability.
A) (Att.) (Adapt.)
B) (Att.) (Adapt.)
C) (Att.) (Adapt.)
D) (Att.) (Adapt.)
(Short Answer)
4.8/5 (38)
Filters
- Essay(0)
- Multiple Choice(0)
- Short Answer(0)
- True False(0)
- Matching(0)