Exam 12: Statistical Control Charts, Nonparametric Tests, and Hypothesis Testing
If test A has an efficiency rating of 0.94 as compared to test B, explain what that efficiency
rating means. Do comparable nonparametric or parametric tests have higher efficiency
ratings?
Higher efficiency ratings have the effect that "significant" results typically require smaller samples. For example if
test A has an efficiency rating of 0.94 as compared to test B, that means that test A requires 100 sample
observations as compared to 94 sample observations for test B. Parametric tests have higher efficiency ratings.
A common goal of quality control is to reduce variation in a product or service. List and_
describe the two types of variability. Give an example of each.
Random variation is due to chance, the variation inherent in any process that is not capable of producing each good
or service exactly the same way every time. Assignable variation results from causes that can be identified.
Examples may vary.
Describe a p chart and give an example.
A p chart is a sequential plot of proportions of some process attribute over time. The horizontal axis is used for time,
and the vertical axis is used for the proportions of that attribute of the samples. Examples will vary. A p chart
attempts to monitor the proportion of a particular attribute.
A control chart for is shown below. Determine whether the process mean is within statistical control. If it is not, identify which of the three out-of-control criteria lead to rejection of a statistically stable mean. 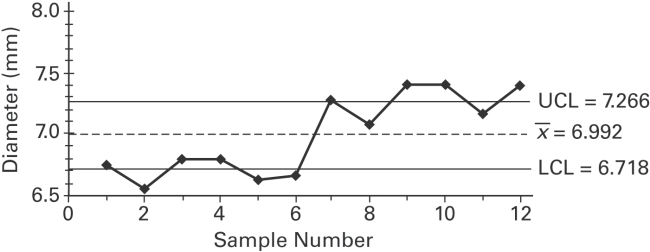
Use the Wilcoxon rank-sum test to test the claim that the two independent samples come from
populations with equal medians. Use the Wilcoxon rank-sum approach to test the claim that
the sample student grade averages at two colleges come from populations with the same
median. The sample data is listed below. Use a 0.05 level of significance, and assume that the
samples were randomly selected. College A 3.2 4.0 2.4 2.6 2.0 1.8 1.3 0.0 0.5 1.4 2.9 College B 2.4 1.9 0.3 0.8 2.8 3.0 3.1 3.1 3.1 3.5 3.5
One way analysis of variance is used to test for _________________________________.
When applying the runs test for randomness above and below the median for 12 dollar/Euro
exchange rate highs, the test statistic is G = 2. What does that value tell us about the data?
Use the given process data to construct a control chart for p. A candy manufacturer considers a cracked piece of candy to be a defect. Each day 100 candies are randomly selected and
Checked for cracks. The numbers of defects for 20 consecutive days are given below. 14 4 5 5 5 5 5 6 6 6 6 12 6 6 6 7 6 7 8 7 What is the value of the center line?
Given below are the analysis of variance results from a Minitab display._ to use a 0.05 significance level in testing the null hypothesis that the different samples come
From populations with the same mean. Identify the value of the test statistic. Source Factor 3 13.500 4.500 5.17 0.011 Error 16 13.925 0.870 Total 19 27.425
Use the sign test to test the indicated claim. The waiting times (in minutes)of 28 randomly_
selected customers in a bank are given below. Use a significance level of 0.05 to test the claim
that the population median is equal to 5.3 minutes. 8.2 8.0 10.5 3.8 6.4 5.3 7.8 2.9 6.0 7.7 6.1 5.9 1.2 10.4 7.3 6.9 5.8 5.1 6.2 3.1 5.8 11.7 4.5 6.5 9.8 7.4 2.3 7.8
Match the chart with its characteristic.
-The centerline is
Test the claim that the samples come from populations with the same mean. Assume that the
populations are normally distributed with the same variance. The data below represent the
weight losses for people on three different exercise programs. Exercise A Exercise B Exercise C 2.5 5.8 4.3 8.8 4.9 6.2 7.3 1.1 5.8 9.8 7.8 8.1 5.1 1.2 7.9 At the 1% significance level, does it appear that a difference exists in the true mean weight
loss produced by the three exercise programs?
Sketch a run chart that that indicates that a process is not statistically stable due to increasing
variation.
Use the given process data to construct a control chart for p. A manufacturer monitors the level_
of defects in the television sets that it produces. Each week, 200 television sets are randomly
selected and tested and the number of defects is recorded. The results for 12 consecutive weeks
are shown below. 4 7 5 6 8 3 12 4 4 5 6 2
At the same time each day, a researcher records the temperature in each of three greenhouses.
The table shows the temperatures in degrees Fahrenheit recorded for one week. Greenhouse \#1 Greenhouse \#2 Greenhouse \#3 73 71 67 72 69 63 73 72 62 66 72 61 68 65 60 71 73 62 72 71 59
i)Use a 0.05 significance level to test the claim that the average temperature is the same in
each greenhouse.
ii)How are the analysis of variance results affected if the same constant is added to every
one of the original sample values?
Given below are the analysis of variance results from a Minitab display._ to use a 0.05 significance level in testing the null hypothesis that the different samples come
From populations with the same mean. Identify the P-value. Source DF SS MS F p Factor 3 30 10.00 1.6 0.264 Error 8 50 6.25 Total 11 80
A)
В)
C)
D)
When applying the runs test for randomness above and below the median for 10 scores on a
final exam, the test statistic is G = 2. What does that value tell us about the data?
Match the chart with its characteristic.
-It has no upper or lower control limits.
Fill in the missing entries in the following partially completed one -way ANOVA table._ Source df SS MS=SS/df F -statistic Treatment 3 11.16 Error 13.72 0.686 Total
Filters
- Essay(0)
- Multiple Choice(0)
- Short Answer(0)
- True False(0)
- Matching(0)