Exam 2: Exploring Data With Tables and Graphs
Exam 1: Introduction to Statistics59 Questions
Exam 2: Exploring Data With Tables and Graphs59 Questions
Exam 3: Describing, Exploring, and Comparing Data59 Questions
Exam 4: Probability60 Questions
Exam 5: Discrete Probability Distributions59 Questions
Exam 6: Normal Probability Distributions60 Questions
Exam 7: Estimating Parameters and Determining Sample Sizes58 Questions
Exam 8: Hypothesis Testing57 Questions
Exam 9: Inferences From Two Samples58 Questions
Exam 10: Correlation and Regression56 Questions
Exam 11: Chi-Square and Analysis of Variance60 Questions
Exam 12: Statistical Control Charts, Nonparametric Tests, and Hypothesis Testing181 Questions
Select questions type
The following data set represents Heather's average monthly charges (in $)for cable TV for the
past 12 months. 105 125 110 98 102 115 110 123 118 101 95 128
Construct a frequency distribution with 4 classes.
Charges Frequency
Free
(Essay)
4.8/5  (35)
(35)
Correct Answer: Verified
Smoking and the episodes of lung cancer have a high correlation, but it does not prove _________.
Free
(Multiple Choice)
4.9/5 (36)
Correct Answer:Verified
A
The frequency distribution below summarizes the home sale prices in the city of Summerhill
for the month of June. Determine the class width, class midpoint, and the class boundaries
for the class 235.0-265.9.
Free
(Essay)
4.8/5 (31)
Correct Answer:Verified
class width: 31; class midpoint: 250.45; class boundaries: 234.95, 265.95
Identify the cumulative frequency distribution that corresponds to the given frequency distribution. Speed Number of Cars 0-29 4 30-59 16 60-89 60 90-119 20
(Multiple Choice)
4.9/5 (30)
The following figures represent Latisha's monthly charges (in $)for long distance telephone_
calls for the past twelve months. 7.12 10.40 14.70 18.24 10.48 16.47 7.53 15.45 13.04 15.48 13.33 12.56
Construct a frequency distribution with four classes.
Charges \ Frequency
(Essay)
4.8/5 (29)
The attendance counts for this season's basketball games are listed below. Which of these choices display the correct stemplot? 227 239 215 219
221 233 229 233
235 228 245 231
(Multiple Choice)
4.7/5 (36)
The following frequency distribution analyzes the scores on a math test. Find the class boundaries of scores interval 90-99. Scores Number of Students 50-59 2 60-69 4 70-79 6 80-89 15 90-99 5
(Multiple Choice)
4.9/5 (34)
The frequency distribution below summarizes the home sale prices in the city of Summerhill for the month of June. Determine the class midpoint (in thousand $)for the
Class 235.0 -265.9.
(Multiple Choice)
4.7/5 (33)
According to USA Today, the largest categories of sports equipment sales are as follows:_ fishing ($2.0 billion); firearms and hunting ($3.1 billion); camping ($1.7 billion); golf ($2.5
Billion). What type of graph would depict these different categories and their relative
Amounts the best?
(Multiple Choice)
4.9/5 (42)
A school district performed a study to find the main causes leading to its students_
dropping out of school. Thirty cases were analyzed, and a primary cause was assigned to
each case. The causes included unexcused absences (U), illness (I), family problems (F), and
other causes (O). The results for the thirty cases are listed below: Construct a table summarizing the frequency distribution of the primary causes leading to
student dropout. Cause Frequency
(Essay)
4.8/5 (36)
Use the high closing values of Statstar Inc. stock from the years 2005-2016 to construct a_
time-series graph. (Let x = 0 represent 2005 and so on.)Identify a trend. Year High Year High 2005 48 2011 62 2006 53 2012 60 2007 47 2013 68 2008 55 2014 42 2009 58 2015 51 2010 61 2016 78
(Essay)
4.7/5 (37)
The following data show the number of laps run by each participant in a marathon._ 46 65 55 43 51 48 57 30 43 49 32 56
Which of these choices display the correct stemplot?
(Multiple Choice)
4.9/5 (31)
Suppose that a data set has a minimum value of 24 and a maximum of 79 and that you
want 5 classes. Explain how to find the class width for this frequency table. What happens if
you mistakenly use a class width of 11 instead of 12?
(Essay)
4.9/5 (46)
The ages of the 45 members of a track and field team are listed below. Which of these_ choices display the correct stemplot? 21 18 42 35 32 21 44 25 38 48 14 19 23 22 28
32 34 27 31 17 16 41 37 22 24 33 32 21 26 30
22 27 32 30 20 18 17 21 15 26 36 31 40 16 25
(Multiple Choice)
4.8/5 (40)
Which of the following cumulative frequency distribution corresponds to the given frequency distribution? Weight (oz) Number of Stones 1.2-1.6 5 1.7-2.1 2 2.2-2.6 5 2.7-3.1 5 3.2-3.6 13
(Multiple Choice)
4.7/5 (33)
A nurse measured the blood pressure of each person who visited her clinic. Following is a_ relative-frequency histogram for the systolic blood pressure readings for those people
Aged between 25 and 40 years. The blood pressure readings were given to the nearest
Whole number. Approximately what percentage of the people aged 25 -40 had a systolic
Blood pressure reading between 110 and 139 mm Hg inclusive?
Systolic Blood Pressure for People Aged 25 - 40 Years 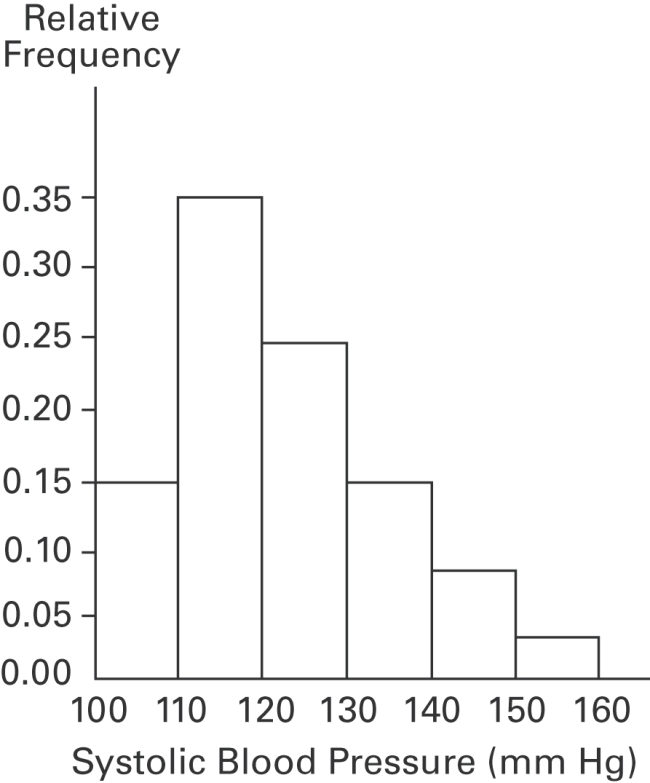
(Multiple Choice)
4.7/5 (28)
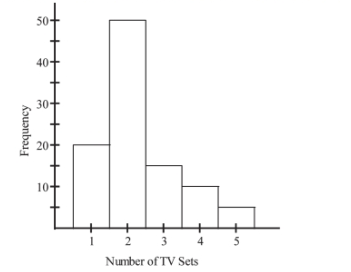
The histogram below represents the number of television sets per household for a sample of U.S. households. What is the sample size? Number of Television Sets Per U.S. Household
(Multiple Choice)
4.9/5 (31)
The frequency distribution below summarizes employee years of service for Alpha Corporation. Determine the width of each class. Years of Service Frequency 1-5 5 6-10 20 11-15 25 16-20 10 21-25 5 26-30 3
(Multiple Choice)
4.7/5 (33)
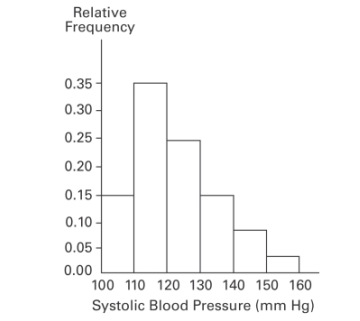
A nurse measured the blood pressure of each person who visited her clinic. Following is a_ relative-frequency histogram for the systolic blood pressure readings for those people
Aged between 25 and 40 years. The blood pressure readings were given to the nearest
Whole number. Approximately what percentage of the people aged 25 -40 had a systolic
Blood pressure reading between 110 and 119 mm Hg inclusive? Systolic Blood Pressure for People Aged 25 - 40 Years
(Multiple Choice)
4.8/5 (36)
Explain in your own words why a bar graph can be misleading if one or both of the scales
begin at some value other than zero.
(Essay)
4.8/5 (34)
Filters
- Essay(0)
- Multiple Choice(0)
- Short Answer(0)
- True False(0)
- Matching(0)