Exam 10: Correlation and Regression
Exam 1: Introduction to Statistics59 Questions
Exam 2: Exploring Data With Tables and Graphs59 Questions
Exam 3: Describing, Exploring, and Comparing Data59 Questions
Exam 4: Probability60 Questions
Exam 5: Discrete Probability Distributions59 Questions
Exam 6: Normal Probability Distributions60 Questions
Exam 7: Estimating Parameters and Determining Sample Sizes58 Questions
Exam 8: Hypothesis Testing57 Questions
Exam 9: Inferences From Two Samples58 Questions
Exam 10: Correlation and Regression56 Questions
Exam 11: Chi-Square and Analysis of Variance60 Questions
Exam 12: Statistical Control Charts, Nonparametric Tests, and Hypothesis Testing181 Questions
Select questions type
The residual is the difference between the ____________________ and the ___________________.
Free
(Multiple Choice)
4.8/5  (26)
(26)
Correct Answer: Verified
B
Given the linear correlation coefficient r and the sample size n, determine the critical values of r_ and use your finding to state whether or not the given r represents a significant linear
Correlation. Use a significance level of 0.05.
Free
(Multiple Choice)
4.7/5 (35)
Correct Answer:Verified
D
Find the value of the linear correlation coefficient r. The paired data below consist of the_ costs of advertising (in thousands of dollars)and the number of products sold (in thousands). Cost 9 2 3 4 2 5 9 10 Number 85 52 55 68 67 86 83 73
Free
(Multiple Choice)
4.9/5 (35)
Correct Answer:Verified
A
Use computer software to find the multiple regression equation. Can the equation be used for prediction? An anti-smoking group used data in the table to relate the carbon monoxide( CO)
Of various brands of cigarettes to their tar and nicotine (NIC)content. CO TAR NIC 15 1.2 16 15 1.2 16 17 1.0 16 6 0.8 9 1 0.1 1 8 0.8 8 10 0.8 10 17 1.0 16 15 1.2 15 11 0.7 9 18 1.4 18 16 1.0 15 10 0.8 9 7 0.5 5 18 1.1 16
(Multiple Choice)
4.8/5 (33)
For the data below, determine the value of the linear correlation coefficient r between y and X₂. x 1.2 2.7 4.4 6.6 9.5 y 1.6 4.7 9.9 24.5 39.0
(Multiple Choice)
4.8/5 (34)
Construct a scatterplot for the given data._ \begin{tabular} { c | l l l l l l l c }
& & & & & & & & \\
\hline & & & & & & & &
\end{tabular}
(Multiple Choice)
4.7/5 (42)
A regression equation is obtained for a set of data. After examining a scatter diagram, the_
researcher notices a data point that is potentially an influential point. How could she
confirm that this data point is indeed an influential point?
(Essay)
4.7/5 (36)
Suppose you will perform a test to determine whether there is sufficient evidence to support a claim of a linear correlation between two variables. Find the critical values of r given the
Number of pairs of data n and the significance level
(Multiple Choice)
4.8/5 (41)
Use computer software to find the multiple regression equation. Can the equation be used for_ prediction? A wildlife analyst gathered the data in the table to develop an equation to predict
The weights of bears. He used WEIGHT as the dependent variable and CHEST, LENGTH,
And SEX as the independent variables. For SEX, he used male=1 and female=2. WEIGHT CHEST LENGTH SEX 344 45.0 67.5 1 416 54.0 72.0 1 220 41.0 70.0 2 360 49.0 68.5 1 332 44.0 73.0 1 140 32.0 63.0 2 436 48.0 72.0 1 132 33.0 61.0 2 356 48.0 64.0 2 150 35.0 59.0 1 202 40.0 63.0 2 365 50.0 70.5 1
A) WEIGHT CHEST ; Yes, because the is high.
B) WEIGHT ; Yes, because the -value is high. C) WEIGHT CHEST + 3.6LENGTH SEX; Yes, because the adjusted is high.
D) WEIGHT .1CHEST LENGTH SEX; Yes, because the -value is low.
(Short Answer)
4.7/5 (27)
The following residual plot is obtained after a regression equation is determined for a set
of data. Does the residual plot suggest that the regression equation is a bad model? Why or
why not? 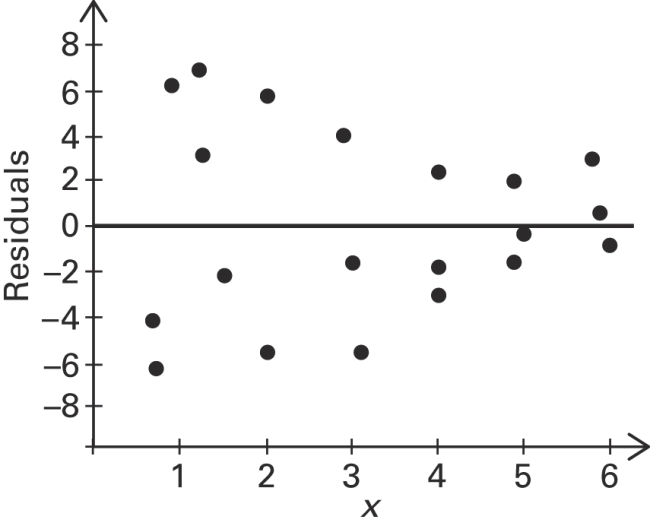
(Essay)
5.0/5 (29)
When testing to determine if correlation is significant, we use the hypotheses What does the symbol represent? Explain the meaning of the null and altemative hypotheses.
(Essay)
4.7/5 (31)
Define the terms predictor variable and response variable. Give examples for each._
(Essay)
4.9/5 (34)
Use computer software to find the best multiple regression equation to explain the variation in the dependent variable, Y, in terms of the independent variables, Y 456 9896 29.1 1 421 9680 42.3 2 653 10449 29.8 3 573 10811 26.0 4 CORRELATION COEFFICIENTS 546 10014 34.3 5 499 10293 22.7 6 Y/=0.509 504 9413 24.2 7 Y/=0.280 611 9860 31.6 8 Y/ =0.930 646 9782 25.6 9 789 12139 37.9 10 COEFFICIENTS OF DETERMINATION 773 12166 33.9 11 753 9976 37.4 12 Y/ =0.259 852 10645 27.0 13 YI =0.079 755 9738 31.5 14 Y/=0.864 815 9933 39.9 15 Y/ ,=0.880 902 10132 25.3 16 Y/ ,,=0.884 986 11145 30.4 17 909 9775 32.7 18 945 9549 35.0 19 866 10077 33.8 20 1178 11550 29.4 21 1230 10600 37.1 22 1207 11280 42.9 23 968 12100 32.2 24 1118 12420 30.5 25
(Multiple Choice)
4.8/5 (31)
A(n)___________________________ is a point lying far away from other data points on a scatterplot.
(Multiple Choice)
4.9/5 (37)
Describe what scatterplots are and discuss the importance of creating scatterplots._
(Essay)
4.8/5 (37)
Use computer software to find the best multiple regression equation to explain the variation in the dependent variable, Y , in terms of the independent variables,
Y 15 1.2 16 15 1.2 16 CORRELATION COEFFICIENT 17 1.0 16 Y/=0.886 6 0.8 9 Y/=0.965 1 0.1 1 8 0.8 8 10 0.8 10 COEFFICIENTS OF DETERMINATION 17 1.0 16 15 1.2 15 11 0.7 9 18 1.4 18 16 1.0 15 =0.932 10 0.8 9 =0.943 7 0.5 5 18 1.1 16
(Multiple Choice)
4.9/5 (38)
Given the linear correlation coefficient r and the sample size n, determine the critical values of_ r and use your finding to state whether or not the given r represents a significant linear
Correlation. Use a significance level of 0.05.
(Multiple Choice)
5.0/5 (43)
Use computer software to find the best multiple regression equation to explain the variation in_ the dependent variable, Y, in terms of the independent variables, Y 98.6 87.4 108.5 101.2 97.6 110.1 102.4 96.7 110.4 CORRELATION COEFFICIENTS 100.9 98.2 104.3 102.3 99.8 107.2 Y/=0.850 101.5 100.5 105.8 Y=0.742 101.6 103.2 107.8 101.6 107.8 103.4 99.8 96.6 102.7 COEFFICIENT OF DETERMINATION 100.3 88.9 104.1 97.6 75.1 99.2 97.2 76.9 99.7 97.3 84.6 102.0 96.0 90.6 94.3 99.2 103.1 97.7 100.3 105.1 101.1 100.3 96.4 102.3 104.1 104.4 104.4 105.3 110.7 108.5 107.6 127.1 111.3
(Multiple Choice)
4.9/5 (33)
The table below shows the population of a city (in millions)in each year during the period
2010-2015. Using the number of years since 2010 as the independent variable, find the
regression equation of the best model. Assume that the model is to be used only for the
scope of the given data, and consider only linear, quadratic, logarithmic, exponential, and
power models. Include the type of model and the equation for the model you find. Year 2010 2011 2012 2013 2014 2015 Population(millions) 1.08 1.37 1.68 2.19 2.73 3.34
(Essay)
4.8/5 (35)
Find the coefficient of determination, given that the value of the linear correlation coefficient,_ r, is 0.738.
(Multiple Choice)
4.8/5 (36)
Filters
- Essay(0)
- Multiple Choice(0)
- Short Answer(0)
- True False(0)
- Matching(0)