Exam 6: Normal Probability Distributions
Exam 1: Introduction to Statistics59 Questions
Exam 2: Exploring Data With Tables and Graphs59 Questions
Exam 3: Describing, Exploring, and Comparing Data59 Questions
Exam 4: Probability60 Questions
Exam 5: Discrete Probability Distributions59 Questions
Exam 6: Normal Probability Distributions60 Questions
Exam 7: Estimating Parameters and Determining Sample Sizes58 Questions
Exam 8: Hypothesis Testing57 Questions
Exam 9: Inferences From Two Samples58 Questions
Exam 10: Correlation and Regression56 Questions
Exam 11: Chi-Square and Analysis of Variance60 Questions
Exam 12: Statistical Control Charts, Nonparametric Tests, and Hypothesis Testing181 Questions
Select questions type
Three randomly selected households are surveyed as a pilot project for a larger survey to
be conducted later. The numbers of people in the households are 5, 7, and 9. Consider the
values of 5, 7, and 9 to be a population. Assume that samples of size n = 2 are randomly
selected with replacement from the population of 5, 7, and 9. The nine different samples are
as follows: (5, 5), (5, 7), (5, 9), (7, 5), (7, 7), (7, 9), (9, 5), (9, 7), and (9, 9). (i)Find the mean
of each of the nine samples, then summarize the sampling distribution of the means in the
format of a table representing the probability distribution. (ii)Compare the population mean
to the mean of the sample means. (iii)Do the sample means target the value of the
population mean? In general, do means make good estimators of population means? Why or
why not?
Free
(Essay)
4.9/5  (40)
(40)
Correct Answer: Verified
(i) (ii)The mean of the population is 7.00 people and the mean of the sample means is also 7.00 people.
(iii)The sample means target the population mean. Sample means make good estimators of population means
because they target the value of the population mean instead of systematically underestimating or overestimating
it.
Estimate the probability of getting exactly 43 boys in 90 births. Estimate the indicated probability by using the normal distribution as an approximation to the binomial distribution.
Free
(Multiple Choice)
4.7/5 (33)
Correct Answer:Verified
A
The continuity correction is used to compensate for the fact that a ___________distribution is used to approximate a ____________ distribution.
Free
(Multiple Choice)
4.8/5 (30)
Correct Answer:Verified
B
Find the area of the shaded region. The graph depicts the standard normal distribution with mean 0 and standard deviation 1. 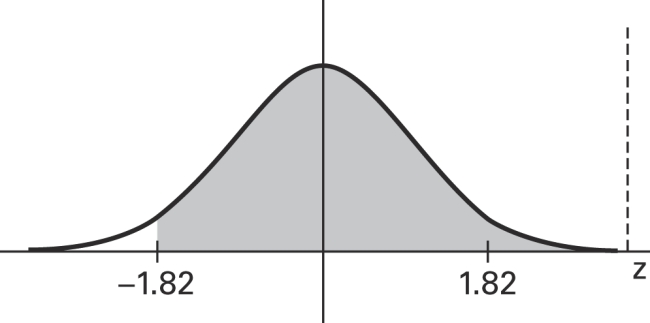
(Multiple Choice)
4.9/5 (37)
The given values are discrete. Use the continuity correction and describe the region of the normal distribution that corresponds to the indicated probability.
The probability of no more than 35 defective CDs
(Multiple Choice)
4.8/5 (41)
Scores on a test have a mean of 70 and is 83 . The scores have a distribution that is approximately normal. Find (You will need to first find the standard deviation.)
(Multiple Choice)
4.7/5 (38)
If a sample size is < _____, the sample size must come from a population having a normal distribution in order to follow normal distribution calculations.
(Multiple Choice)
4.9/5 (34)
Suppose that you wish to find
minimum of −3 and a maximum of 3. If you incorrectly assume that the distribution is
normal instead of uniform, will your answer be too big, too small, or will you still obtain the
correct answer? Explain your thinking.
(Essay)
4.8/5 (31)
SAT verbal scores are normally distributed with a mean of 430 and a standard deviation of
120 (based on data from the College Board ATP). (a)If a single student is randomly selected,
find the probability that the sample mean is above 500. (b)If a sample of 35 students are
selected randomly, find the probability that the sample mean is above 500. These two
problems appear to be very similar. Which problem requires the application of the central
limit theorem, and in what way does the solution process differ between the two problems?
(Essay)
4.8/5 (40)
State the central limit theorem. Describe the sampling distribution for a population that is
uniform and for a population that is normal.
(Essay)
4.9/5 (43)
A normal quartile plot is given below for the lifetimes (in hours)of a sample of batteries of
a particular brand. Use the plot to assess the normality of the lifetimes of these batteries.
Explain your reasoning. 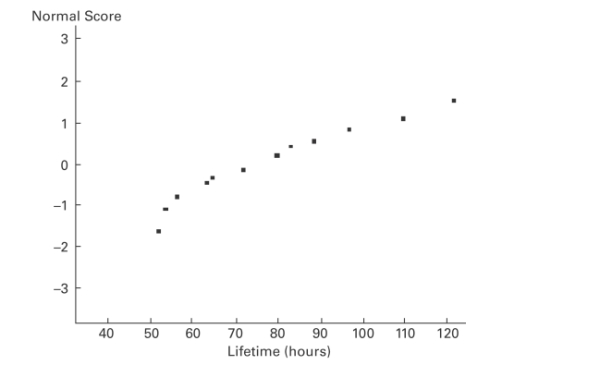
(Essay)
4.9/5 (37)
A baseball player has a batting average of 0.346, so the probability of a hit is 0.346. Assume that his hitting attempts are independent of each other. Assume that the batter gets up to bat 4
Times in each game. Estimate the probability that in 50 consecutive games, there are at least
45 games in which the batter gets at least one hit. (Hint: first find the probability that in one
Game the batter gets at least one hit)
(Multiple Choice)
4.9/5 (31)
Find the area of the shaded region. The graph depicts the standard normal distribution with mean 0 and standard deviation 1. 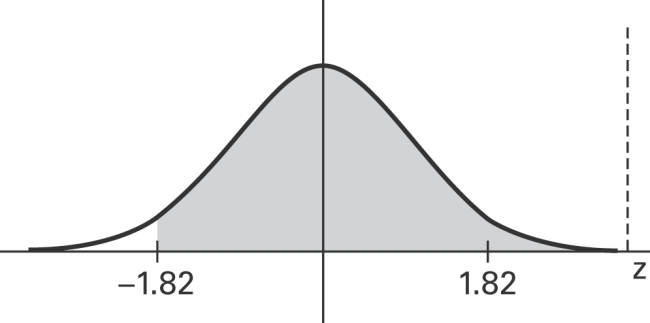
(Multiple Choice)
4.7/5 (38)
Define a density curve and describe the two properties that it must satisfy. Show a density
curve for a uniform distribution. Make sure that your graph satisfies both properties.
(Essay)
4.9/5 (36)
The lengths of human pregnancies are normally distributed with a mean of 268 days and a standard deviation of 15 days. What is the probability that a pregnancy last at least 300 days?
(Multiple Choice)
4.7/5 (28)
Find the probability that in 200 tosses of a fair die, we will obtain at most 30 fives. Use the normal distribution to approximate the desired probability.
(Multiple Choice)
4.9/5 (45)
Define the central limit theorem and its relationship to the sampling distribution of sample
means. Define how you can approximate a normal distribution from an original population
that is not normally distributed
(Essay)
4.8/5 (35)
After constructing a new manufacturing machine, five prototype integrated circuit chips are
produced and it is found that two are defective and three are acceptable. Assume that two of
the chips are randomly selected with replacement from this population. After identifying the
25 possible samples, find the proportion of defects in each of them, using a table to describe
the sampling distribution of the proportions of the defects.
(Essay)
4.8/5 (42)
Assume that the red blood cell counts of women are normally distributed with a mean of 4.577 million cells per microliter and a standard deviation of 0.382 million cells per
Microliter. Approximately what percentage of women have red blood cell counts in the
Normal range from 4.2 to 5.4 million cells per microliter?
(Multiple Choice)
4.9/5 (33)
Explain how a nonstandard normal distribution differs from the standard normal
distribution. Describe the process for finding probabilities for nonstandard normal
distributions.
(Essay)
4.8/5 (34)
Filters
- Essay(0)
- Multiple Choice(0)
- Short Answer(0)
- True False(0)
- Matching(0)