Exam 10: Correlation and Regression
Exam 1: Introduction to Statistics59 Questions
Exam 2: Exploring Data With Tables and Graphs59 Questions
Exam 3: Describing, Exploring, and Comparing Data59 Questions
Exam 4: Probability60 Questions
Exam 5: Discrete Probability Distributions59 Questions
Exam 6: Normal Probability Distributions60 Questions
Exam 7: Estimating Parameters and Determining Sample Sizes58 Questions
Exam 8: Hypothesis Testing57 Questions
Exam 9: Inferences From Two Samples58 Questions
Exam 10: Correlation and Regression56 Questions
Exam 11: Chi-Square and Analysis of Variance60 Questions
Exam 12: Statistical Control Charts, Nonparametric Tests, and Hypothesis Testing181 Questions
Select questions type
Use the given information to find the coefficient of determination. A regression equation is_ obtained for a collection of paired data. It is found that the total variation is 20.711, the
Explained variation is 18.592, and the unexplained variation is 2.119.
(Multiple Choice)
4.7/5  (36)
(36)
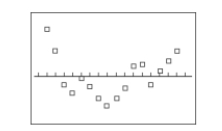
The following table gives the US domestic oil production rates (excluding Alaska)from 1987
to 2002. A regression equation was fit to the data and the residual plot is shown below. Year Millions of Barrels per Day 1987 6.39 1988 6.12 1989 5.74 1990 5.58 1991 5.62 1992 5.46 1993 5.26 1994 5.10
Year Millions of Barrels per Day 1995 5.08 1996 5.07 1997 5.16 1998 5.08 1999 4.83 2000 4.85 2001 4.84 2002 4.83
(Essay)
4.9/5 (46)
Suppose you will perform a test to determine whether there is sufficient evidence to support a claim of a linear correlation between two variables. Find the critical value(s)of r given that and .
(Multiple Choice)
4.7/5 (40)
Use computer software to obtain the multiple regression equation and identify adjusted and the P -value. An anti-smoking group used data in the table to relate the carbon monoxide (CO) of various brands of cigarettes to their tar and nicotine (NIC) content.
CO TAR NIC 15 1.2 16 15 1.2 16 17 1.0 16 6 0.8 9 1 0.1 1 8 0.8 8 10 0.8 10 17 1.0 16 15 1.2 15 11 0.7 9 18 1.4 18 16 1.0 15 10 0.8 9 7 0.5 5 18 1.1 16
(Multiple Choice)
4.8/5 (36)
The residual is the ________________ the observed value of y and the predicted value of y.
(Multiple Choice)
4.9/5 (36)
The table lists the value y (in dollars)of $100 deposited in a certificate of deposit (CD)at a
bank after y years. Year 1 2 3 4 5 20 Value 103 106.09 109.27 112.55 115.93 180.61 Construct a scatterplot and identify the mathematical model that best fits the given data.
Assume that the model is to be used only for the scope of the given data, and consider only
linear, quadratic, logarithmic, exponential, and power models. Include the type of model and
the equation for the model you find.
(Essay)
4.9/5 (31)
Determine which plot shows the strongest linear correlation._
(Multiple Choice)
5.0/5 (41)
Find the explained variation for the paired data. The equation of the regression line for the paired data below is
9 7 2 3 4 22 17 43 35 16 21 23 102 81
(Multiple Choice)
4.9/5 (33)
Suppose you will perform a test to determine whether there is sufficient evidence to support a claim of a linear correlation between two variables. Find the critical values of r given the number of pairs of data n and the significance level .
n=12 ,
(Multiple Choice)
4.8/5 (42)
The results for several randomly selected students for test 1 and test 2 grades are given
below. Test 1 59 63 65 69 58 77 76 69 70 64 Test 2 72 67 78 82 75 87 92 83 87 78 Is there sufficient evidence to suggest that there is a linear correlation between test 1 and test
2 grades? Construct a scatterplot, and find the value of the linear correlation coefficient r.
Also, find the P-value or the critical value(s)of r using α
= 0.05.
(Essay)
4.8/5 (37)
Based on the scatterplot, select the most likely value of the linear correlation coefficient r. 
(Multiple Choice)
4.8/5 (41)
Find the value of the linear correlation coefficient r. The paired data below consist of the costs of advertising (in thousands of dollars)and the number of products sold (in thousands): Cost 9 2 3 4 2 5 9 10 Number 85 52 55 68 67 86 83 73
(Multiple Choice)
4.8/5 (37)
Use the given data to find the equation of the regression line. Round the final values to three significant digits, if necessary. Two different tests are designed to measure employee
Productivity and dexterity. Several employees are randomly selected and tested with these
Results. Productivity (x) 23 25 28 21 21 25 26 30 34 36 Dexterity (y) 49 53 59 42 47 53 55 63 67 75
(Multiple Choice)
4.9/5 (28)
A(n)___________________________ is a point that strongly affects the graph of the regression line.
(Multiple Choice)
4.8/5 (35)
Use the given data to find the equation of the regression line. Round the final values to three_ significant digits, if necessary. x 1 3 5 7 9 y 143 116 100 98 90
(Multiple Choice)
4.8/5 (38)
The table below lists weights (carats)and prices (dollars)for randomly selected diamonds.
Find the regression equation, letting the weight be the predictor variable. Find the best
predicted price for a diamond with a weight of 1.50 carats. What is wrong with predicting the
price of a 1.50-carat diamond? Weight 0.3 0.4 0.5 0.5 1.0 0.7 Price 510 1151 1343 1410 5669 2277
(Essay)
4.9/5 (31)
Use the given data to find the equation of the regression line. Round the final values to three significant digits, if necessary. x 6 8 20 28 36 y 2 4 13 20 30
(Multiple Choice)
4.7/5 (36)
Based on the scatterplot, select the most likely value of the linear correlation coefficient r. 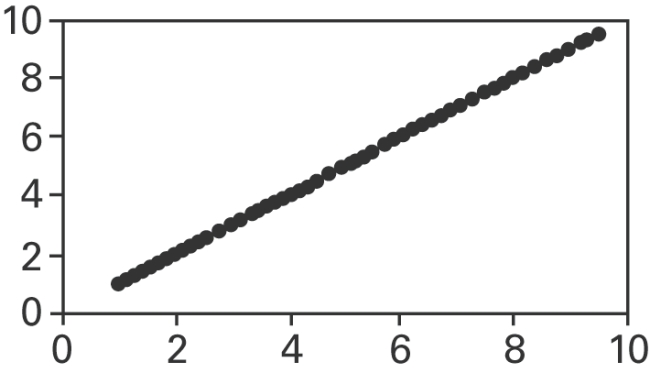
(Multiple Choice)
4.8/5 (35)
Provide an appropriate response. For the data below, determine the logarithmic equation, ya=+b lnx that best fits the data. Hint: Begin by replacing each x-value with ln x then use
The usual methods to find the equation of the least squares regression line. x 1.2 2.7 4.4 6.6 9.5 y 1.6 4.7 8.9 9.5 12.0
A)
B)
C)
C)
(Short Answer)
4.9/5 (32)
For each of 200 randomly selected cities, Pete recorded the number of churches in the city_
(x)and the number of homicides in the past decade (y). He calculated the linear
correlation coefficient and was surprised to find a strong positive linear correlation for the
two variables. Does this suggest that building new churches causes an increase in the number
of homicides? Why do you think that a strong positive linear correlation coefficient was
obtained? Explain your answer with reference to the term lurking variable.
(Essay)
4.7/5 (48)
Filters
- Essay(0)
- Multiple Choice(0)
- Short Answer(0)
- True False(0)
- Matching(0)