Exam 2: Exploring Data With Tables and Graphs
Exam 1: Introduction to Statistics59 Questions
Exam 2: Exploring Data With Tables and Graphs59 Questions
Exam 3: Describing, Exploring, and Comparing Data59 Questions
Exam 4: Probability60 Questions
Exam 5: Discrete Probability Distributions59 Questions
Exam 6: Normal Probability Distributions60 Questions
Exam 7: Estimating Parameters and Determining Sample Sizes58 Questions
Exam 8: Hypothesis Testing57 Questions
Exam 9: Inferences From Two Samples58 Questions
Exam 10: Correlation and Regression56 Questions
Exam 11: Chi-Square and Analysis of Variance60 Questions
Exam 12: Statistical Control Charts, Nonparametric Tests, and Hypothesis Testing181 Questions
Select questions type
The weights (in pounds)of 22 members of the junior varsity football team are listed below. 144 152 142 151 160 152 131 164 141 153 140
144 175 156 147 133 172 159 135 159 148 171
Which of these choices display the correct stemplot?
(Multiple Choice)
4.9/5  (35)
(35)
The scatterplot below displays the amount of nitrous oxide (NO)explained by the amount of_ carbon monoxide (CO)emissions in million metric tons over a ten year period in the United
States. Select the choice that best describes any relationship between the variables. 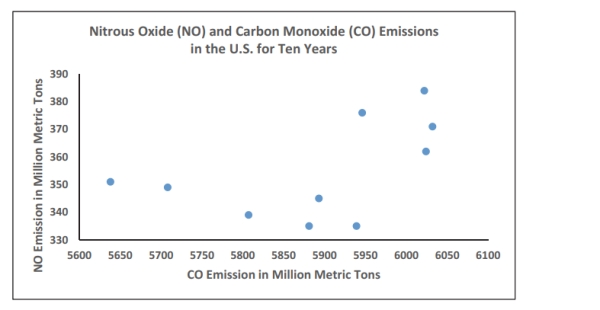
(Multiple Choice)
4.9/5 (35)
The following data represent the number of cars passing through a toll booth during a certain time period over a number of days. 38 39 37 37 44 38 41 38 39 35 42 39 43 37 41
Which of these choices display the correct dotplot?
(Multiple Choice)
4.8/5 (36)
Analysis of the data from 25 mothers indicates that an infant's birth weight (g), y , can be estimated by a mother's weight (kg), x , using the regression equation y=31 x+1501 . For every
(kg) increase in a mother's weight, the infant's birth weight increases by
g.
(Multiple Choice)
4.9/5 (47)
Identify the cumulative frequency distribution that corresponds to the given frequency_ distribution. Speed Number of Cars 0-29 4 30-59 16 60-89 60 90-119 20
(Multiple Choice)
4.7/5 (27)
A store manager counts the number of customers who make a purchase in his store each_ day. The data are as follows. 10 11 8 14 7 10 10 11 8 7
Which of these choices display the correct dotplot?
(Multiple Choice)
4.9/5 (29)
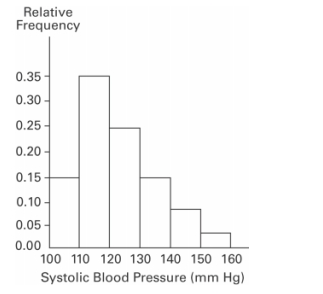
A nurse measured the blood pressure of each person who visited her clinic. Following is a_ relative-frequency histogram for the systolic blood pressure readings for those people
Aged between 25 and 40 years. The blood pressure readings were given to the nearest
Whole number. Approximately what percentage of the people aged 25 -40 had a systolic
Blood pressure reading between 110 and 139 mm Hg inclusive? Systolic Blood Pressure for People Aged 25-40 Years
(Multiple Choice)
4.8/5 (25)
The following frequency distribution depicts the scores on a math test. Find the class_ midpoint of scores for the interval 95-99. Scores Number of Students 75-79 2 80-84 4 85-89 6 90-94 15 95-99 5
(Multiple Choice)
4.8/5 (33)
A bar chart and a Pareto chart both use bars to show frequencies of categories of categorical_
data. What characteristic distinguishes a Pareto chart from a bar chart and how does that
characteristic help us in understanding the data?
(Essay)
4.8/5 (26)
The Kappa Iota Sigma Fraternity polled its members on the weekend party theme. The_ vote was as follows: six for toga, four for hayride, eight for luau, and two for masquerade.
Display the vote count in a Pareto chart.
(Multiple Choice)
4.9/5 (36)
In a survey, 20 people were asked how many magazines they had purchased during the
previous year. The results are shown below. Construct a histogram to represent the data.
Use 4 classes with a class width of 10, and begin with a lower class limit of -0.5. What is the
approximate amount at the center? 6 15 3 36 25 18 12 18 5 30 24 7 0 22 33 24 19 4 12 9 
(Essay)
4.8/5 (40)
x 0.51 0.02 0.14 0.29 0.34 0.8 0.47 0.71 y 0.31 0.46 -0.12 0.34 -0.05 0.8 0.35 0.47 Which of these choices display the correct scatterplot?
(Multiple Choice)
4.8/5 (32)
The data shows the roundtrip mileage that 43 randomly selected students drive to school_
each day. Construct a frequency polygon. Applying a loose interpretation of the requirements
for a normal distribution, do the mileages appear to be normally distributed? Why or why not? Miles Frequency 10-14 0 15-19 6 20-24 9 25-29 21 30-34 7
(Essay)
4.9/5 (36)
Kevin asked some of his friends how many hours they had worked during the previous
week at their after-school jobs. The results are shown below. 5 6 5 4 5 5 9 8 5 3 7 6 6 7 5 6 7 5 6 8 6 7 8 4
Construct a frequency distribution. Use 4 classes, a class width of 2 hours, and a lower limit of 3 for class 1 .
Hours Frequency
(Essay)
4.9/5 (38)
The two key parts of a regression equation involve the ____________ and the y-____________.
(Multiple Choice)
4.9/5 (31)
The Kappa Iota Sigma Fraternity polled its members on the weekend party theme. The vote was as follows: six for toga, four for hayride, eight for luau, and two for masquerade.
Which of these choices display the correct Pareto chart?
(Multiple Choice)
4.7/5 (37)
In a survey, 26 voters were asked their ages. The results are shown below. Construct a_
histogram to represent the data (with 5 classes beginning with a lower class limit of 19.5 and a
class width of 10). What is the approximate age at the center? 43 56 28 63 67 66 52 48 37 51 40 60 62 66 45 21 35 49 32 53 61 53 69 31 48 59
(Essay)
4.8/5 (20)
The following frequency distribution displays the scores on a math test. Find the class boundaries of scores interval 40-59. Scores Number of Students 50-59 2 60-69 4 70-79 6 80-89 15 90-99 5
(Multiple Choice)
4.8/5 (29)
The histogram below represents the number of television sets per household for a sample of_ U.S. households. What is the sample size? Number of TV Sets Per U.S. Household
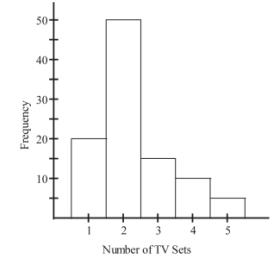
(Multiple Choice)
4.8/5 (43)
Filters
- Essay(0)
- Multiple Choice(0)
- Short Answer(0)
- True False(0)
- Matching(0)