Exam 2: Exploring Data With Tables and Graphs
Exam 1: Introduction to Statistics59 Questions
Exam 2: Exploring Data With Tables and Graphs59 Questions
Exam 3: Describing, Exploring, and Comparing Data59 Questions
Exam 4: Probability60 Questions
Exam 5: Discrete Probability Distributions59 Questions
Exam 6: Normal Probability Distributions60 Questions
Exam 7: Estimating Parameters and Determining Sample Sizes58 Questions
Exam 8: Hypothesis Testing57 Questions
Exam 9: Inferences From Two Samples58 Questions
Exam 10: Correlation and Regression56 Questions
Exam 11: Chi-Square and Analysis of Variance60 Questions
Exam 12: Statistical Control Charts, Nonparametric Tests, and Hypothesis Testing181 Questions
Select questions type
Analysis of the data from 25 mothers indicates that an infant's birth weight can be estimated by a mother's weight (kg), x , using the regression equation
If a mother's weight is 70 kg the infant's birth weight can be estimated as _________
(Multiple Choice)
4.7/5  (29)
(29)
Attendance records at a school show the number of days each student was absent during the_ year. The days absent for each student were as follows. 0 2 3 4 2 3 4 6 7 2 3 4 6 9 8
Which of these choices display the correct dotplot?
(Multiple Choice)
4.9/5 (33)
The frequency distribution below summarizes the home sale prices in the city of_ Summerhill for the month of June. Determine the width of each class.
(Multiple Choice)
4.9/5 (26)
The frequency table below shows the amount of weight loss during the first month of a
diet program for a group of men. Constructing a frequency polygon. Applying a loose
interpretation of the requirements for a normal distribution, do the pounds of weight loss appear
to be normally distributed? Why or why not? Weight (lb) Frequency 5-7 2 8-10 9 11-13 18 14-16 13 17-19 4 20-22 1  20-22 1
(Essay)
4.8/5 (34)
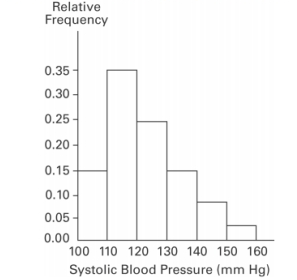
A nurse measured the blood pressure of each person who visited her clinic. Following is a relative-frequency histogram for the systolic blood pressure readings for those people
Aged between 25 and 40 years. The blood pressure readings (in mm Hg)were given to the
Nearest whole number. What class width was used to construct the relative frequency
Distribution? Systolic Blood Pressure for People Aged 25 - 40 Years
(Multiple Choice)
4.9/5 (23)
Wagenlucht Ice Cream Company is always trying to create new flavors of ice cream. They are market testing three kinds to find out which one has the best chance of becoming
Popular. They give small samples of each to 20 people at a grocery store. Four ice cream
Tasters preferred the Strawberry Cream, 12 preferred Choco-Nuts, and four loved the
Orange Mint. Construct a Pareto chart to represent these preferences. Choose the vertical
Scale so that the relative frequencies are represented.
(Multiple Choice)
4.7/5 (41)
The following data set represents Heather's average monthly charges (in $)for cable TV for the_
past 24 months. 105 125 110 98 102 115 110 123 118 101 95 128 110 105 122 107 118 107 117 125 116 110 101 107
Construct a frequency distribution with 4 classes, a class width of 2 hours, and a lower limit of 100 for class 1 .
Charges Frequency
(Essay)
4.8/5 (29)
The following frequency distribution represents the scores on a math test. Find the class_ midpoint of scores for the interval 40-59. Scores Number of students 50-59 2 60-69 4 70-79 6 80-89 15 90-99 5
(Multiple Choice)
4.8/5 (42)
The following data consists of the weights (in pounds)of 15 randomly selected women and_ the weights of 15 randomly selected men. Which of these choices display the correct back-
To-back stemplot? Women: 128 150 118 166 142 122 137 110 175 152 145 126 139 111 170 Men: 140 153 199 186 169 136 176 162 196 155 173 190 141 166 153
(Multiple Choice)
4.9/5 (31)
Define the difference between a Relative Frequency Distribution and a Cumulative Frequency
Distribution.
(Essay)
4.9/5 (31)
Describe the differences between a histogram and a stemplot and discuss the advantages and
disadvantages of each.
(Essay)
4.9/5 (31)
Which choice displays the best graphic display of the amount of nitrous oxide (NO)1)____________ explained by the amount of carbon monoxide (CO)emissions in million metric tons over a
Ten year period in the United States? The data set is below: Athlete Before 115.2 114 116.4 119.8 110.9 112.4 111.5 117.3 After 112.9 112.7 114 120.6 109.1 109.1 107.9 113.4
(Multiple Choice)
4.9/5 (48)
Graphs should be constructed in a way that is fair and objective. A common deceptive graph
alters the axes of the graph in what way?
(Essay)
4.7/5 (36)
Describe how a data point labeled as an outlier can affect the analysis of a data set in a
frequency distribution or histogram.
(Essay)
4.9/5 (35)
A nurse measured the blood pressure of each person who visited her clinic. Following is_ a relative-frequency histogram for the systolic blood pressure readings for those people
Aged between 25 and 40 years. The blood pressure readings were given to the nearest
Whole number. Approximately what percentage of the people aged 25 -40 had a systolic
Blood pressure reading between 110 and 119 mm Hg inclusive?
Systolic Blood Pressure for People Aged 25 - 40 Years 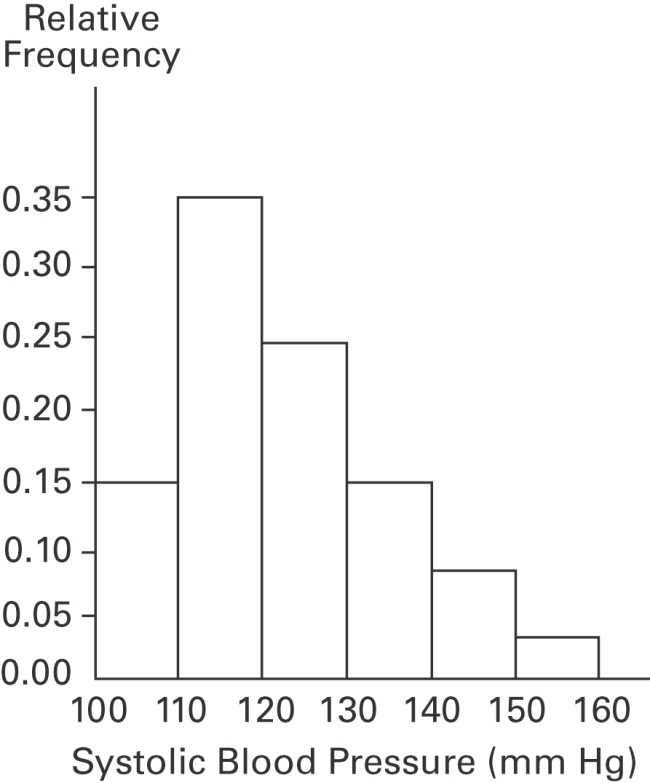
(Multiple Choice)
4.9/5 (33)
The frequency distribution below summarizes employee years of service for Alpha Corporation. Find the class midpoint for class 1 -5. Years of Service Frequency 1-5 5 6-10 20 11-15 25 16-20 10 21-25 5 26-30 3
(Multiple Choice)
4.9/5 (30)
A manufacturer records the number of errors each work station makes during the week. The data are as follows. 6 3 2 3 5 2 0 2 5 4 2 0 1
Which of these choices display the correct dotplot?
(Multiple Choice)
4.8/5 (33)
The following data show the number of laps run by each participant in a marathon. 46 65 55 43 51 48 57 30 43 49 32 56
Which of these choices display the correct stemplot?
(Multiple Choice)
4.9/5 (29)
The graph below shows the number of car accidents occurring in one city in each of the_
years 2011 through 2016. The number of accidents dropped in 2013 after a new speed limit
was imposed. Does the graph distort the data? How would you redesign the graph to be less
misleading? 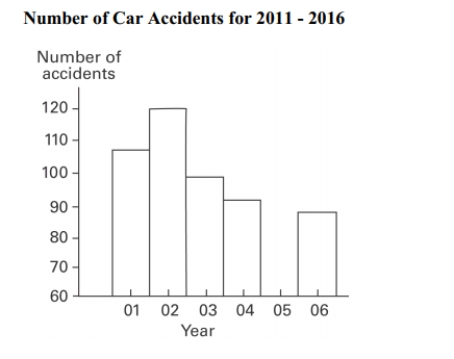
(Essay)
4.8/5 (32)
The linear __________ coefficient denoted by r measures the __________ of the linear association between two variables.
(Multiple Choice)
4.9/5 (32)
Filters
- Essay(0)
- Multiple Choice(0)
- Short Answer(0)
- True False(0)
- Matching(0)