Exam 10: Hypothesis Tests Regarding a Parameter
Exam 1: Data Collection113 Questions
Exam 2: Organizing and Summarizing Data82 Questions
Exam 3: Numerically Summarizing Data141 Questions
Exam 4: Describing the Relation Between Two Variables72 Questions
Exam 5: Probability257 Questions
Exam 6: Discrete Probability Distributions131 Questions
Exam 7: The Normal Probability Distribution120 Questions
Exam 8: Sampling Distributions52 Questions
Exam 9: Estimating the Value of a Parameter88 Questions
Exam 10: Hypothesis Tests Regarding a Parameter140 Questions
Exam 11: Inferences on Two Samples129 Questions
Exam 12: Inference on Categorical Data38 Questions
Exam 13: Comparing Three or More Means51 Questions
Select questions type
Test the claim that Assume that the population is normally distributed,
Free
(Essay)
4.9/5  (39)
(39)
Correct Answer: Verified
critical values =1.735 and =23.589 ; standardized test statistic 9.926 ; fail to reject H0 ; There is not sufficient evidence to support the claim.
Test the claim that  Assume that the population is normally distributed.
Free
(Essay)
4.7/5 (38)
Correct Answer:Verified
critical value =36.191 ; standardized test statistic reject H0 ; There is sufficient evidence to reject the claim.
The mean age of professors at a university is greater than 58.3 years. If a hypothesis test is performed, how should you interpret a decision that rejects the null hypothesis?
Free
(Multiple Choice)
4.8/5 (34)
Correct Answer:Verified
A
The mean repair bill of cars is greater than $110. Write the null and alternative hypotheses.
(Essay)
4.8/5 (33)
A local group claims that the police issue at least 60 parking tickets a day in their area. To prove their point,they randomly select two weeks. Their research yields the number of tickets issued for each day. The data arelisted below. At α = 0.01, test the groupʹs claim. Round the test statistic to the nearest thousandth. 70 48 41 68 69 55 70 57 60 83 32 60 72 58
(Essay)
4.8/5 (40)
The mean age of principals in a local school district is 50.2 years. If a hypothesis test is performed, how should you interpret a decision that rejects the null hypothesis?
(Multiple Choice)
4.9/5 (23)
It has been estimated that the G-car obtains a mean of 40 miles per gallon on the highway, and the company that manufactures the car claims that it exceeds this estimate in highway driving. To support its assertion, the company randomly selects 36 G-cars and records the mileage obtained for each car over a driving course similar to that used to obtain the estimate. The following data resulted:  miles per gallon, s=6 miles per gallon. Calculate the value of
  if the true value of the mean is really 42 miles per gallon. Use
(Essay)
4.8/5 (30)
It is desired to test H0: μ = 12 against H1: μ ≠ 12 using α = 0.05. The population in question is uniformlydistributed with a standard deviation of 2.0. A random sample of 100 will be drawn from this population. If μis really equal to 11.9, what is the value of β associated with this test?
(Multiple Choice)
4.9/5 (40)
Suppose you want to test the claim that Given a sample size of n=48 and a level of significance of =0.01 , when should you reject H0 ?
(Multiple Choice)
4.8/5 (25)
Determine the critical value for a left-tailed test of a population standard deviation for a sample of size n = 21at the α = 0.05 level of significance.
(Multiple Choice)
4.8/5 (36)
What is the probability associated with not making a Type II error?
(Multiple Choice)
4.8/5 (41)
The mean number of rushing yards for one NFL team was less than 99 yards per game. If a hypothesis test is performed, how should you interpret a decision that rejects the null hypothesis?
(Multiple Choice)
4.9/5 (42)
Determine the critical values for a two-tailed test of a population mean at the α = 0.01 level of significancebased on a sample size of n = 29.
(Multiple Choice)
4.9/5 (37)
The weights (in ounces) of a sample of tomatoes of a particular variety are summarized in the boxplot below.Based on the boxplot, is a large sample necessary to conduct a hypothesis test about the mean weight? If so,why? 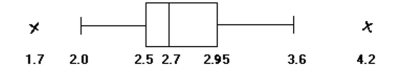
(Multiple Choice)
4.9/5 (37)
Find the standardized test statistic t for a sample with your answer to three decimal places.
(Multiple Choice)
4.8/5 (36)
Find the critical value for a two-tailed test with α = 0.08.
(Multiple Choice)
4.9/5 (35)
When the results of a hypothesis test are determined to be statistically significant, then we _______________ thenull hypothesis.
(Multiple Choice)
4.9/5 (37)
Filters
- Essay(0)
- Multiple Choice(0)
- Short Answer(0)
- True False(0)
- Matching(0)