Exam 2: Organizing and Summarizing Data
Exam 1: Data Collection113 Questions
Exam 2: Organizing and Summarizing Data82 Questions
Exam 3: Numerically Summarizing Data141 Questions
Exam 4: Describing the Relation Between Two Variables72 Questions
Exam 5: Probability257 Questions
Exam 6: Discrete Probability Distributions131 Questions
Exam 7: The Normal Probability Distribution120 Questions
Exam 8: Sampling Distributions52 Questions
Exam 9: Estimating the Value of a Parameter88 Questions
Exam 10: Hypothesis Tests Regarding a Parameter140 Questions
Exam 11: Inferences on Two Samples129 Questions
Exam 12: Inference on Categorical Data38 Questions
Exam 13: Comparing Three or More Means51 Questions
Select questions type
Determine the number of classes in the frequency table below. Class Frequency 38-39 7 40-41 2 42-43 6 44-45 4 46-47 1
Free
(Multiple Choice)
4.7/5  (32)
(32)
Correct Answer: Verified
A
In what quarter was the revenue the least for Year 2?
Free
(Multiple Choice)
4.8/5 (33)
Correct Answer:Verified
A
The class midpoint can be determined by adding to the lower class limit one-half of the class width.
Free
(True/False)
4.9/5 (35)
Correct Answer:Verified
True
An ogive is a graph that represents cumulative frequencies or cumulative relative frequencies. The pointslabeled on the horizontal axis are the
(Multiple Choice)
4.7/5 (29)
The commute times (in minutes) of 30 executives are listed below. Construct a frequency distribution and arelative frequency distribution using five classes. Round relative frequency values to three decimal places. 70 72 71 70 69 73 69 68 70 71
67 71 70 74 69 68 71 71 71 72
69 71 68 67 73 74 70 71 69 68
(Essay)
5.0/5 (27)
The March utility bills (in dollars) of 30 homeowners are listed below. Construct a frequency distribution and arelative frequency distribution using six classes. 44 38 41 50 36 36 43 42 49 48 35 40 37 41 43 50 45 45 39 38 50 41 47 36 35 40 42 43 48 33 Provide an appropriate response.
(Essay)
4.7/5 (40)
The number of home runs that Mark McGwire hit in the first 13 years of his major league baseball career arelisted below. (Source: Major League Handbook) Construct a stem-and-leaf plot for this data. 3 49 32 33 39 22 42 9 9 39 52 58 70
(Essay)
4.9/5 (37)
The commute time (in minutes) of 30 executives are listed below. Construct a frequency distribution, a relativefrequency distribution, a cumulative frequency distribution, and a relative cumulative frequency distributionusing five classes. 70 72 71 70 69 73 69 68 70 71
67 71 70 74 69 68 71 71 71 72
69 71 68 67 73 74 70 71 69 68
(Essay)
4.9/5 (31)
Retailers are always interested in determining why a customer selected their store to make a purchase. Asporting goods retailer conducted a customer survey to determine why its customers shopped at the store. Theresults are shown below. What percentage of the customers responded that the merchandise was the reasonthey shopped at the store? Round to the nearest whole percent 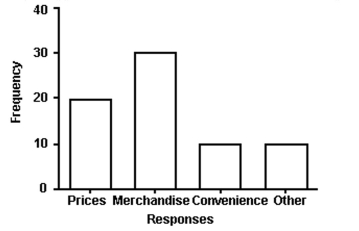
(Multiple Choice)
4.8/5 (38)
Scott Tarnowski owns a pet grooming shop. His prices for grooming dogs are based on the size of the dog. Hisrecords from last year are summarized below. Round percents to whole numbers. Class Frequency Large 345 Medium 830 Small 645
(Essay)
4.9/5 (35)
A frequency polygon always begins and ends with a frequency of zero.
(True/False)
4.8/5 (38)
The scores for an economics test are listed below. Create a stem-and-leaf plot for the data. 87 76 95 77 94 90 88 85 66 89
79 99 50 91 83 88 82 56 19 69 6 Draw dot plots.
(Essay)
4.9/5 (32)
The payroll amounts for 26 major-league baseball teams are shown below. Aprroximately what percentage ofthe payrolls were in the $30-$40 million range? Round to the nearest whole percent. 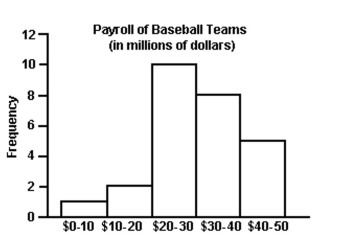
(Multiple Choice)
4.8/5 (37)
The local police, using radar, checked the speeds (in mph) of 30 motorists on a rural road. The results are listedbelow. Construct a relative frequency ogive using six classes. 44 38 41 50 36 36 43 42 49 48 35 40 37 41 43 50 45 45 39 38 50 41 47 36 35 40 42 43 48 33
(Essay)
4.8/5 (38)
The weights (in pounds) of babies born at St Maryʹs hospital last month are summarized in the table. Weight (lb) Number of Babies 5.0-6 5 6.1-7.1 19 7.2-8.2 20 8.3-9.3 9 9.4-10.4 4 Find the class limits for the second class.
(Multiple Choice)
4.9/5 (34)
The data set: Pick Three Lottery Outcomes for 10 Consecutive Weeks 3 6 7 6 0 6 1 7 8 4 1 5 7 5 9 1 5 3 9 9 2 2 3 0 8 8 4 0 2 4
(Multiple Choice)
4.9/5 (32)
The following graph shows the number of car accidents occurring in one city in each of the years 2006 through2011 (Year 1 = 2006, Year 2 = 2007 etc). The number of accidents dropped in 2008 after a new speed limit wasimposed. How is the bar graph misleading? How would you redesign the graph to be less misleading? 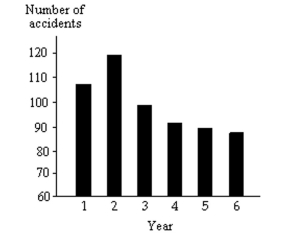
(Essay)
4.7/5 (29)
A random sample of 30 high school students is selected. Each student is asked how much time he or she spenton the Internet during the previous week. The following times (in hours) are recorded: 6 14 8 11 8 6 8 7 5 11 9 7 7 6 9 8 5 5 10 7 5 7 14 9 6 10 6 9 8 7 Construct a frequency histogram for this data.
(Essay)
4.8/5 (40)
Filters
- Essay(0)
- Multiple Choice(0)
- Short Answer(0)
- True False(0)
- Matching(0)