Exam 3: Numerically Summarizing Data
Exam 1: Data Collection113 Questions
Exam 2: Organizing and Summarizing Data82 Questions
Exam 3: Numerically Summarizing Data141 Questions
Exam 4: Describing the Relation Between Two Variables72 Questions
Exam 5: Probability257 Questions
Exam 6: Discrete Probability Distributions131 Questions
Exam 7: The Normal Probability Distribution120 Questions
Exam 8: Sampling Distributions52 Questions
Exam 9: Estimating the Value of a Parameter88 Questions
Exam 10: Hypothesis Tests Regarding a Parameter140 Questions
Exam 11: Inferences on Two Samples129 Questions
Exam 12: Inference on Categorical Data38 Questions
Exam 13: Comparing Three or More Means51 Questions
Select questions type
For the following data set, approximate the sample standard deviation of commuting times per day. Commute (in min) Frequency 50-52 5 53-55 8 56-58 12 59-61 13 62-64 11
Free
(Multiple Choice)
4.8/5  (34)
(34)
Correct Answer: Verified
A
Health care issues are receiving much attention in both academic and political arenas. A sociologist recentlyconducted a survey of citizens over 60 years of age whose net worth is too high to qualify for governmenthealth care but who have no private health insurance. The ages of 25 uninsured senior citizens were as follows: 68 73 66 76 86 74 61 89 65 90 69 92 76 62 81 63 68 81 70 73 60 87 75 64 82 Suppose the mean and standard deviation are 74.0 and 9.7, respectively. If we assume that the distribution ofages is bell shaped, what percentage of the respondents will be between 64.3 and 93.4 years old?
Free
(Multiple Choice)
4.9/5 (32)
Correct Answer:Verified
A
Describe the shape of the histogram. The data set: Pick-Three lottery results for 10 consecutive weeks 3 6 7 6 0 6 1 7 8 4 1 5 7 5 9 1 5 3 9 9 2 2 3 0 8 8 4 0 2 4
Free
(Multiple Choice)
4.9/5 (36)
Correct Answer:Verified
A
The scores from a state standardized test have a mean of 80 and a standard deviation of 10. The distribution ofthe scores is roughly bell shaped. Use the Empirical Rule to find the percentage of scores that lie between 60and 80.
(Multiple Choice)
4.9/5 (28)
The repair costs for five cars which were crashed by a safety testing organization were as follows:$100, $150, $200, $250, and $150. Find the mean cost of repair.
(Multiple Choice)
4.8/5 (40)
For the following data set, approximate the sample standard deviation of monthly telephone bills (in dollars).
(Multiple Choice)
4.9/5 (31)
The one way distances from work (in miles) of 30 employees are listed below. Find Q3. 25 25 26 26.5 27 27 27.5 28 28 28.5 29 29 30 30 30.5 31 31 32 32.5 32.5 33 33 34 34.5 35 35 37 37 38 38
(Multiple Choice)
4.8/5 (41)
A severe drought affected several western states for 3 years. A Christmas tree farmer is worried about thedroughtʹs effect on the size of his trees. To decide whether the growth of the trees has been retarded, the farmerdecides to take a sample of the heights of 25 trees and obtains the following results (recorded in inches): 60 57 62 69 46 54 64 60 59 58 75 51 49 67 65 44 58 55 48 62 63 73 52 55 50 The tree farmer feels the normal height of a tree that was unaffected by the drought would be 65 inches. Findthe z-score for a tree that is 65 inches tall.
(Multiple Choice)
4.7/5 (34)
Solar energy is considered by many to be the energy of the future. A recent survey was taken to compare thecost of solar energy to the cost of gas or electric energy. Results of the survey revealed that the distribution ofthe amount of the monthly utility bill of a 3-bedroom house using gas or electric energy had a mean of $119and a standard deviation of $14. Assuming the distribution is mound-shaped and symmetric, would youexpect to see a 3-bedroom house using gas or electric energy with a monthly utility bill of $203.00? Explain.
(Essay)
4.9/5 (41)
On a recent day during the flu season, the Midtown Medical Clinic saw many patients. Patients had theirtemperatures (in °F) taken. The distribution of temperatures is given below. Determine the mean temperatureof a sample of 100 patients. Temperatures Frequency 95.6-96.49 1 96.5-97.39 3 97.4-98.29 19 98.3-99.19 28 99.2-100.09 35 100.1-100.99 12 101.0-101.89 2
(Multiple Choice)
4.8/5 (35)
Describe the shape of the histogram. The data set: round-trip commuting times (in minutes) of 20 randomlyselected employees 135 120 115 132 136 124 119 145 98 110 125 120 115 130 140 105 116 121 125 108
(Multiple Choice)
4.9/5 (37)
Fill in the blank. ____________ gives us a method of interpreting the standard deviation that applies to any dataset, regardless of the shape of the distribution.
(Multiple Choice)
4.7/5 (30)
The January utility bills (in dollars) for 20 residents of a large city are listed below. Find the range of the data. 70 72 71 70 69 73 69 68 70 71
67 71 70 74 69 68 71 71 71 72
(Multiple Choice)
4.8/5 (40)
An Excel printout of some descriptive statistics for a set of data is shown below. What is the IQR? 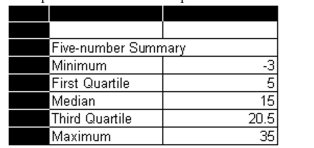
(Multiple Choice)
4.8/5 (34)
The commute times (in minutes) of 30 employees are listed below. Find Q3. 31 41 45 48 52 55 56 56 63 65
67 67 69 70 70 74 75 78 79 79
80 81 83 85 85 87 90 92 95 99
(Multiple Choice)
4.9/5 (34)
A study was designed to investigate the effects of two variables - (1) a studentʹs level of mathematical anxietyand (2) teaching method - on a studentʹs achievement in a mathematics course. Students who had a low levelof mathematical anxiety were taught using the traditional expository method. These students obtained a meanscore of 460 with a standard deviation of 40 on a standardized test. Assuming a bell-shaped distribution,where would approximately 68% of the students score?
(Multiple Choice)
4.9/5 (31)
Filters
- Essay(0)
- Multiple Choice(0)
- Short Answer(0)
- True False(0)
- Matching(0)