Exam 4: Describing the Relation Between Two Variables
Exam 1: Data Collection113 Questions
Exam 2: Organizing and Summarizing Data82 Questions
Exam 3: Numerically Summarizing Data141 Questions
Exam 4: Describing the Relation Between Two Variables72 Questions
Exam 5: Probability257 Questions
Exam 6: Discrete Probability Distributions131 Questions
Exam 7: The Normal Probability Distribution120 Questions
Exam 8: Sampling Distributions52 Questions
Exam 9: Estimating the Value of a Parameter88 Questions
Exam 10: Hypothesis Tests Regarding a Parameter140 Questions
Exam 11: Inferences on Two Samples129 Questions
Exam 12: Inference on Categorical Data38 Questions
Exam 13: Comparing Three or More Means51 Questions
Select questions type
The data below are the final exam scores of 10 randomly selected history students and the number of hoursthey slept the night before the exam. Find the equation of the regression line for the given data. What would bethe predicted score for a history student who slept 15 hours the previous night? Is this a reasonable question?Round your predicted score to the nearest whole number. Round the regression line values to the nearesthundredth. Hours, 3 5 2 8 2 4 4 5 6 3 Scores, 65 80 60 88 66 78 85 90 90 71
Free
(Multiple Choice)
4.7/5  (31)
(31)
Correct Answer: Verified
A
In which scatter diagram is r = -1? 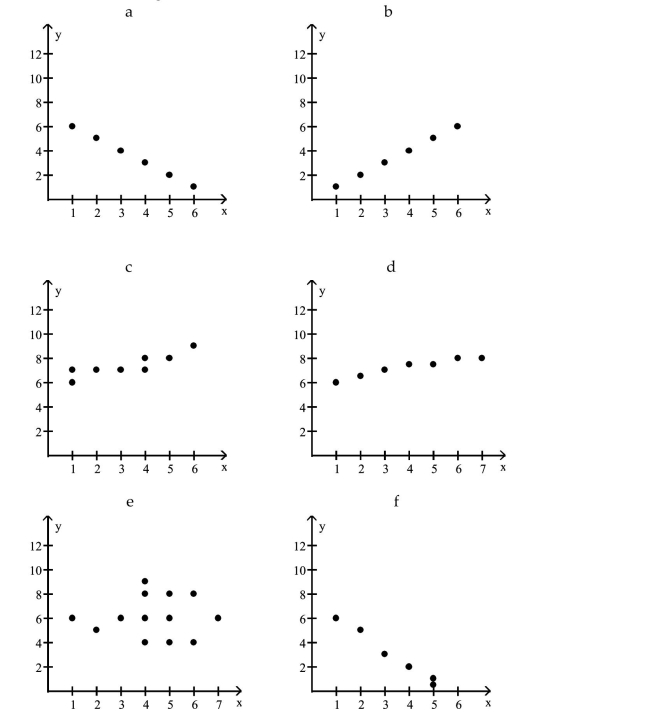
Free
(Multiple Choice)
4.9/5 (29)
Correct Answer:Verified
A
The data below are the average one-way commute times (in minutes) for selected students and the number ofabsences for those students during the term. Find the equation of the regression line for the given data. Whatwould be the predicted number of absences if the commute time was 95 minutes? Is this a reasonable question?Round the predicted number of absences to the nearest whole number. Round the regression line values to thenearest hundredth. Commute time (), 72 85 91 90 88 98 75 100 80 Number of absences, 3 7 10 10 8 15 4 15 5
Free
(Multiple Choice)
4.8/5 (36)
Correct Answer:Verified
A
In order for employees of a company to work in a foreign office, they must take a test in the language of thecountry where they plan to work. The data below show the relationship between the number of years thatemployees have studied a particular language and the grades they received on the proficiency exam. Number of years, 3 4 4 5 3 6 2 7 3 Grades on test, 61 68 75 82 73 90 58 93 72
(Essay)
4.8/5 (36)
There is no correlation between years of education and births per woman. 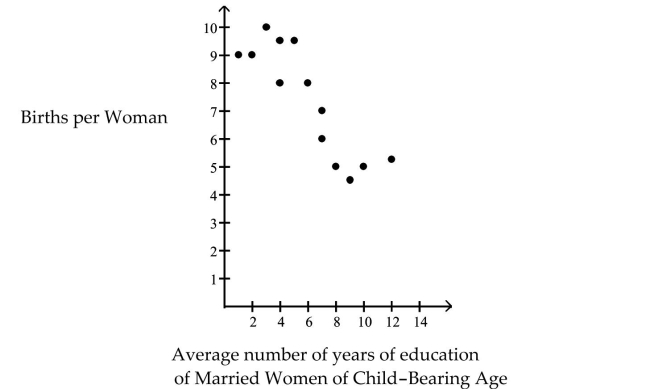
(True/False)
4.7/5 (34)
Construct a scatter diagram for the given data. Determine whether there is a positive linear correlation,negative linear correlation, or no linear correlation. -5 -3 4 1 -1 -2 0 2 3 -4 -10 -8 9 1 -2 -6 -1 3 6 -8
(Essay)
4.9/5 (31)
There is a causal relationship between years of education and births per woman. 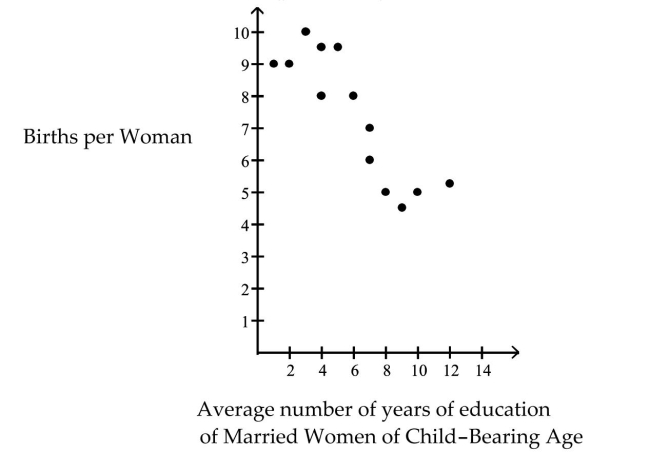
(True/False)
4.8/5 (36)
In order for a companyʹs employees to work in a foreign office, they must take a test in the language of thecountry where they plan to work. The data below shows the relationship between the number of years thatemployees have studied a particular language and the grades they received on the proficiency exam. Find theequation of the regression line for the given data. Round the regression line values to the nearest hundredth. Number of years, 3 4 4 5 3 6 2 7 3 Grades on test, 61 68 75 82 73 90 58 93 72
(Multiple Choice)
4.8/5 (39)
The scores of nine members of a local community college womenʹs golf team in two rounds of tournament playare listed below. Player 1 2 3 4 5 6 7 8 9 Round 1 85 90 87 78 92 85 79 93 86 Round 2 90 87 85 84 86 78 77 91 82
(Essay)
4.8/5 (28)
The data below are the number of hours worked (per week) and the final grades of 9 randomly selectedstudents from a drama class. Calculate the linear correlation coefficient. Hours worked, 3 6 9 7 12 5 18 11 8 Final Grade, 91 79 73 75 64 85 48 69 75
(Multiple Choice)
4.7/5 (30)
A traffic officer is compiling information about the relationship between the hour or the day and the speed overthe limit at which the motorist is ticketed. He computes a correlation coefficient of 0.12. What does this tellthe officer?
(Multiple Choice)
4.8/5 (35)
For a random sample of 30 countries, the linear correlation coefficient between the infant mortality rate and theaverage number of cars per capita was found to be r = -0.717. What does this imply? Does this suggest that ifpeople buy more cars, this could lower the infant mortality rate? Why or why not? What is a likely lurkingvariable?
(Essay)
4.9/5 (42)
A manager wishes to determine the relationship between the number of miles traveled (in hundreds of miles)by her sales representatives and their amount of sales (in thousands of dollars) per month. Find the equation ofthe regression line for the given data. What would be the predicted sales if the sales representative traveled 0miles? Is this reasonable? Why or why not? Round the regression line values to the nearest hundredth. Miles traveled, 2 3 10 7 8 15 3 1 11 Sales, 31 33 78 62 65 61 48 55 120
(Multiple Choice)
4.9/5 (33)
A variable that is related to either the response variable or the predictor variable or both, but which is excludedfrom the analysis is a
(Multiple Choice)
4.9/5 (37)
A medical researcher wishes to determine if there is a relationship between the number of prescriptions writtenby medical professionals, per 100, children and the childʹs age. She surveys all the pediatricianʹs in ageographical region to collect her data. What is the response variable?
(Multiple Choice)
4.9/5 (39)
Find the equation of the regression line for the given data. Round values to the nearest thousandth. -5 -3 4 1 -1 -2 0 2 3 -4 11 -6 8 -3 -2 1 5 -5 6 7
(Multiple Choice)
4.8/5 (33)
A scatter diagram locates a point in a two dimensional plane. The diagram locates thevariable on the horizontal axis and the variable on the vertical axis.
(Multiple Choice)
4.7/5 (30)
Filters
- Essay(0)
- Multiple Choice(0)
- Short Answer(0)
- True False(0)
- Matching(0)