Exam 2: Linear Models, Equations, and Inequalities
Exam 1: Functions, Graphs, and Models; Linear Functions306 Questions
Exam 2: Linear Models, Equations, and Inequalities212 Questions
Exam 3: Quadratic, Piecewise-Defined, and Power Functions261 Questions
Exam 4: Additional Topics With Functions299 Questions
Exam 5: Exponential and Logarithmic Functions304 Questions
Exam 6: Higher-Degree Polynomial and Rational Functions262 Questions
Exam 7: Systems of Equations and Matrices196 Questions
Exam 8: Special Topics in Algebra265 Questions
Select questions type
The table below gives the quantity of a product demanded and the quantity supplied for various prices. Solve the
problem.
-Find the linear equation that gives the price as a function of the quantity demanded. Price (dollars) Quantity Demanded Quantity Supplied 100 850 0 120 830 30 140 810 60 160 790 90 180 770 120
(Multiple Choice)
4.9/5  (30)
(30)
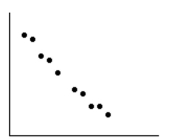
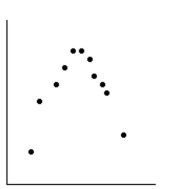
Use the data shown in the scatter plot to determine whether the data should be modeled by a linear function.
-
(Multiple Choice)
4.8/5 (41)
Solve the equation for y.
-Suppose the sales of a particular brand of appliance satisfy the relationship , where represents the number of sales in year , with corresponding to 2010 . In what year would the sales be
(Multiple Choice)
4.7/5 (37)
Find the linear function that is the best fit for the given data. Round decimal values to the nearest hundredth, if
necessary.
- x 24 26 28 30 32 y 15 13 20 16 24
(Multiple Choice)
4.8/5 (41)
Solve the inequality graphically. Give the solution in interval notation.
-Use the -intercept method to solve .
(Multiple Choice)
4.9/5 (39)
Write the best-fit linear model for the data.
-Managers rate employees according to job performance and attitude. The results for several randomly selected employees are given below. Find the linear function to model this data. Performance 59 63 65 69 58 77 76 69 70 64 2-9 Attitude 72 67 78 82 75 87 92 83 87 78
(Multiple Choice)
4.9/5 (31)
Solve the inequality and draw a number line graph of the solution.
-
(Multiple Choice)
4.8/5 (39)
Find the linear function that is the best fit for the given data. Round decimal values to the nearest hundredth, if
necessary.
- x 2 3 7 8 10 3 4 4 5 6
(Multiple Choice)
4.9/5 (27)
Find the linear function that is the best fit for the given data. Round decimal values to the nearest hundredth, if
necessary.
- 3 5 7 15 16 8 11 7 14 20
(Multiple Choice)
4.9/5 (45)
Solve the system of equations graphically, if a solution exists.
- \[\begin{array} { l }
3 x + 2 y = 14 \\
- 2 x + 3 y = 8
(Multiple Choice)
4.9/5 (36)
Write the best-fit linear model for the data.
-The ages and lengths of several animals of the same species are recorded in the following table: Age (months) Length (inches) 12 10 15 11 17 17 21 23 26 23 28 24 32 32 38 40 41 38
Find the linear function to model this data.
(Multiple Choice)
4.8/5 (35)
Give the coordinates of the point of intersection of the linear equations.
- 2x+y=2 3x+2y=2
(Multiple Choice)
4.9/5 (30)
Construct a scatter plot of the data in the table.
- -14 4 6 9 11 16 -5 -2 -12 3 5 6 11 7 7 7 2 2
(Multiple Choice)
4.9/5 (31)
Provide an appropriate response.
-Under what conditions must the inequality symbol be reversed when solving an inequality?
(Essay)
4.7/5 (26)
Write the best-fit linear model for the data.
-The paired data below consist of the costs of advertising (in thousands of dollars) and the number of products sold (in thousands). Find a linear function that approximates the number of products sold as a function of the cost of advertising. Cost 9 2 3 4 2 5 9 10 Number 85 52 55 68 67 86 83 73
(Multiple Choice)
4.7/5 (28)
Use the data shown in the scatter plot to determine whether the data should be modeled by a linear function.
-
(Multiple Choice)
4.8/5 (34)
Filters
- Essay(0)
- Multiple Choice(0)
- Short Answer(0)
- True False(0)
- Matching(0)