Exam 2: Linear Models, Equations, and Inequalities
Exam 1: Functions, Graphs, and Models; Linear Functions306 Questions
Exam 2: Linear Models, Equations, and Inequalities212 Questions
Exam 3: Quadratic, Piecewise-Defined, and Power Functions261 Questions
Exam 4: Additional Topics With Functions299 Questions
Exam 5: Exponential and Logarithmic Functions304 Questions
Exam 6: Higher-Degree Polynomial and Rational Functions262 Questions
Exam 7: Systems of Equations and Matrices196 Questions
Exam 8: Special Topics in Algebra265 Questions
Select questions type
To find the number of units that gives break-even for the product, solve the equation R ound your answer to the
nearest whole unit.
-There were 28,000 people at a ballgame in Los Angeles. The day's receipts were $203,000. How many people paid $11 for reserved seats and how many paid $6 for general admission?
(Multiple Choice)
4.9/5  (37)
(37)
Write the best-fit linear model for the data.
-A study was conducted to compare the average time spent in the lab each week versus course grade for computer students. The results are recorded in the table below. The linear model for this data is , where is the number of hours spent in the lab and is grade on the test. Use this model to predict the grade of a student who spends 12 hours in the lab.
(Multiple Choice)
4.9/5 (31)
Find the linear function that is the best fit for the given data. Round decimal values to the nearest hundredth, if
necessary.
- x 2 3 7 8 10 y 2 4 4 6 6
(Multiple Choice)
4.8/5 (35)
Solve the equation using graphical methods. Round to the nearest thousandth when appropriate.
-
(Multiple Choice)
4.9/5 (31)
Write the best-fit linear model for the data.
-The paired data below consist of the temperatures on randomly chosen days and the amount a certain kind of plant grew (in millimeters). The linear model for this data is , where is temperature and is growth in millimeters. Use this model to predict the growth of a plant if the temperature is
Temp 62 76 50 51 71 46 51 44 79 Growth 36 39 50 13 33 33 17 6 16
(Multiple Choice)
4.9/5 (40)
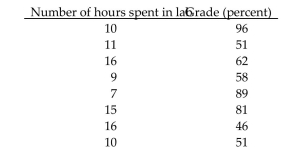
Write the best-fit linear model for the data.
-A study was conducted to compare the average time spent in the lab each week versus course grade for computer students. The results are recorded in the table below. Find a linear function that approximates a student's course grade
As a function of the number of hours spent in lab. Number of hours spent in labrade (percent) 10 96 11 51 16 62 9 58 7 89 15 81 16 46 10 51
(Multiple Choice)
4.9/5 (41)
Solve the inequality and draw a number line graph of the solution.
-
(Multiple Choice)
4.8/5 (35)
Write the best-fit linear model for the data.
-The paired data below consist of the test scores of 6 randomly selected students and the number of hours they studied for the test. Find a linear function that approximates a student's score as a function of the number of hours he or she
Studied. Hours 5 10 4 6 10 9 Score 64 86 69 86 59 87
(Multiple Choice)
4.8/5 (34)
Solve the equation using graphical methods. Round to the nearest thousandth when appropriate.
-
(Multiple Choice)
4.9/5 (33)
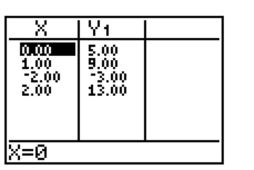
You are given a table showing input and output values for a given function x). Use the table to answer the
question.
-What is the -intercept of the graph of ?
(Multiple Choice)
4.7/5 (33)
Does the system have a unique solution, no solution, or many solutions?
-
(Multiple Choice)
4.8/5 (30)
Write the best-fit linear model for the data.
-Ten students in a graduate program were randomly selected. Their grade point averages (GPAs) when they entered the program were between 3.5 and 4.0. The following data were obtained regarding their GPAs on entering the program
Versus their current GPAs. Find a linear function that approximates a student's current GPA as a function of his or her
Entering GPA. Entering GPA Current GPA 3.5 3.6 3.8 3.7 3.6 3.9 3.6 3.6 3.5 3.9 3.9 3.8 4.0 3.7 3.9 3.9 3.5 3.8 3.7 4.0
(Multiple Choice)
4.9/5 (25)
To find the number of units that gives break-even for the product, solve the equation R ound your answer to the
nearest whole unit.
-A manufacturer has total revenue given by the function and has total cost given by , 000 , where is the number of units produced and sold.
(Multiple Choice)
4.8/5 (33)
Filters
- Essay(0)
- Multiple Choice(0)
- Short Answer(0)
- True False(0)
- Matching(0)